


Research
Patience Powered by Fundamental Research
Small Caps Just Had Their Best Quarter Since 2020. What Does History Suggest Comes Next?
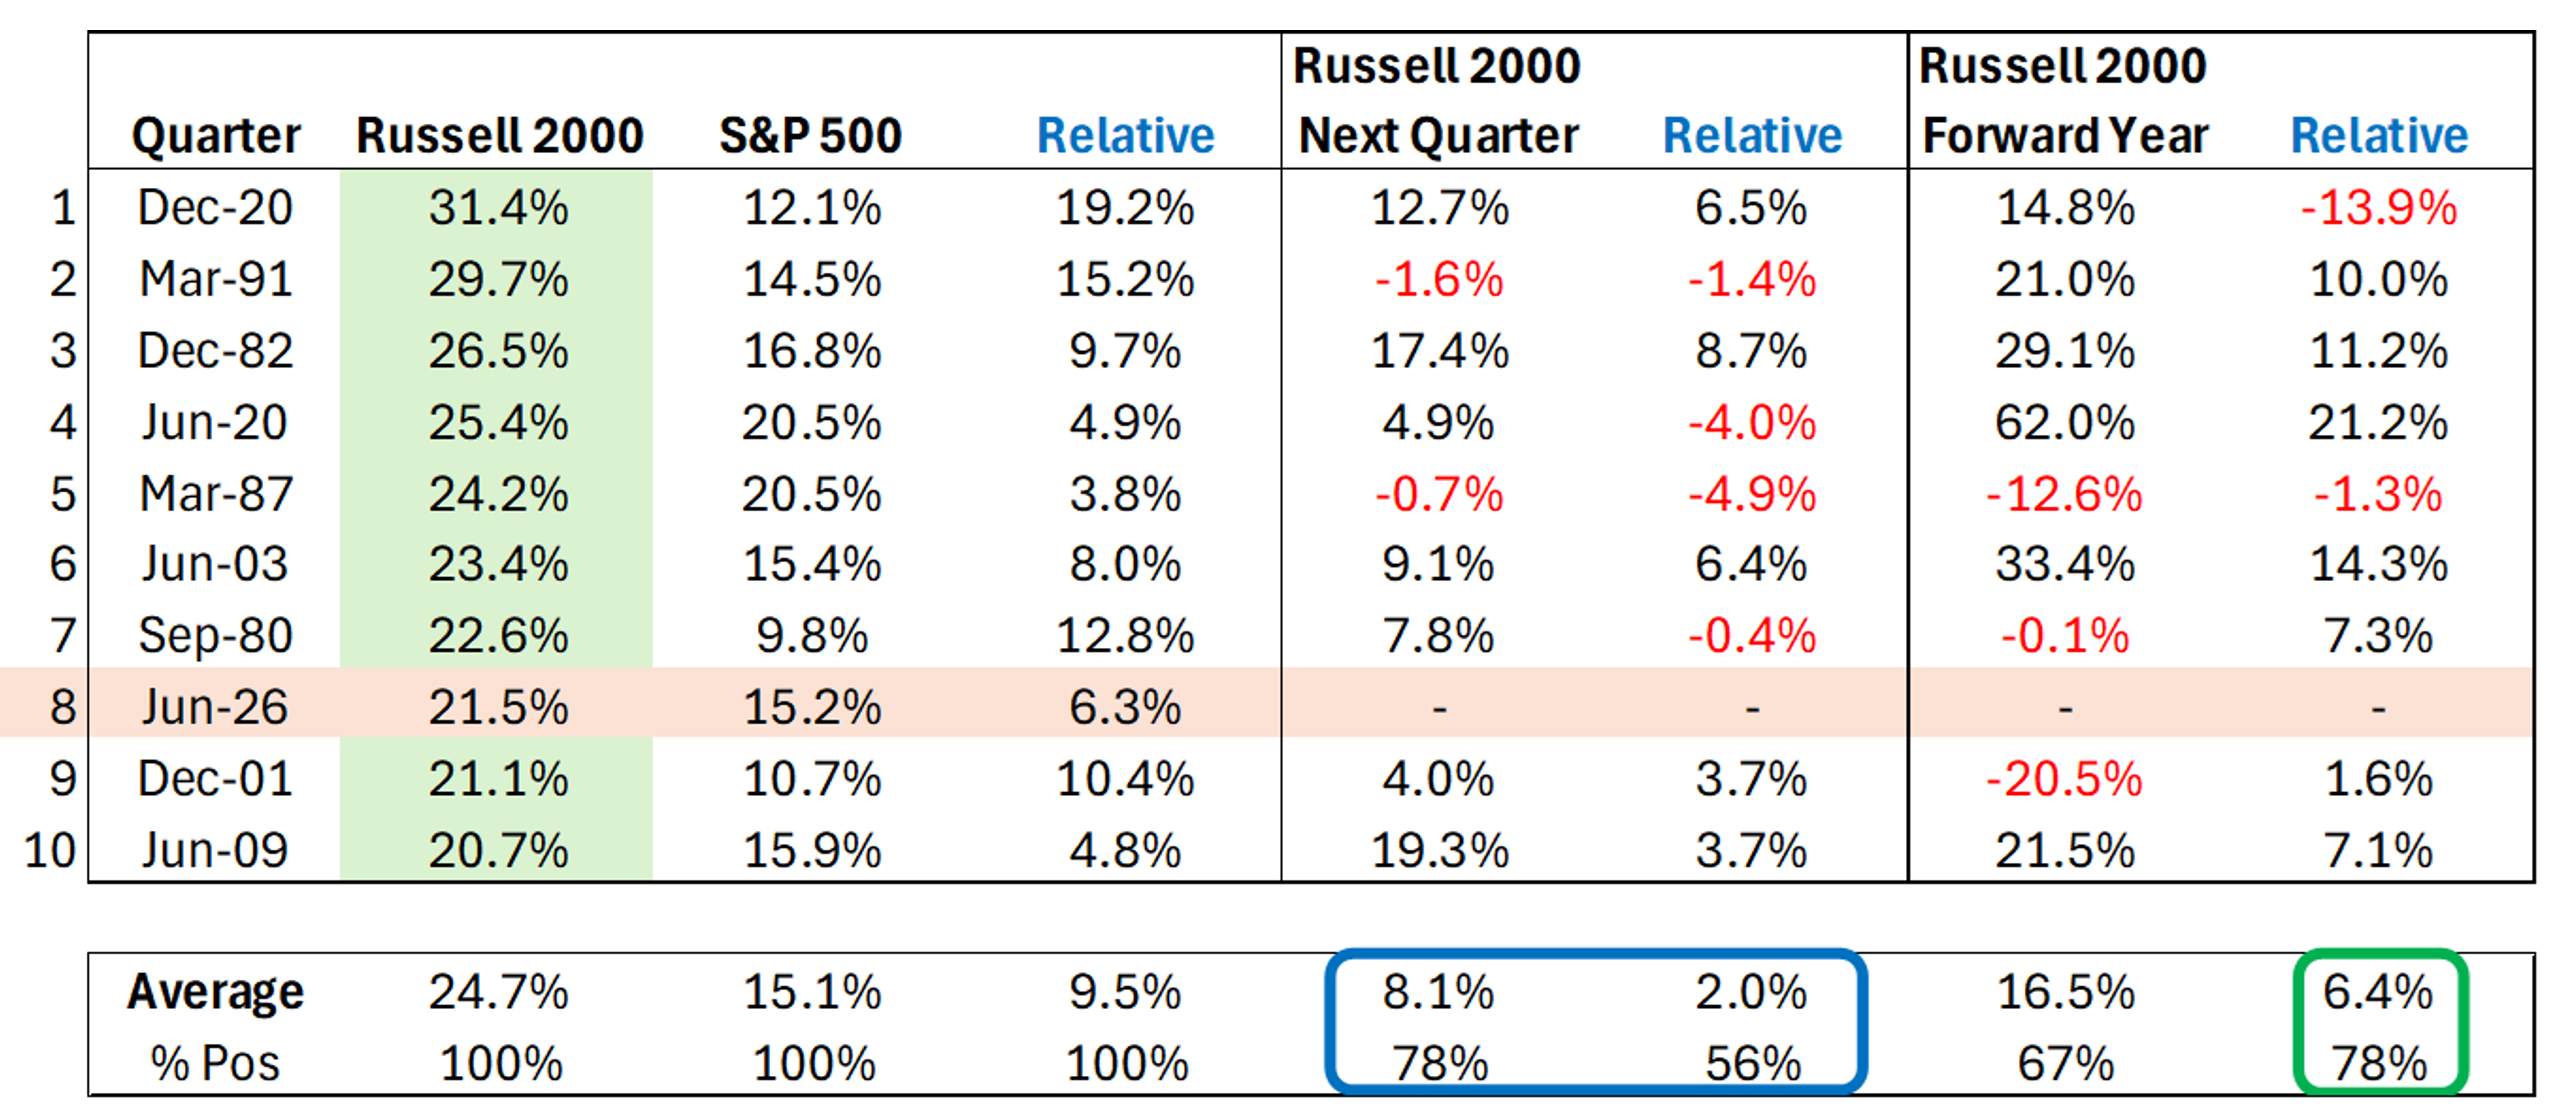
The Russell 2000 surged more than 20% in Q2 2026, delivering its best quarter since Q4 2020 and the 8th best quarterly return since 1978.
Historically, moves of this magnitude have been worth paying attention to.
Following quarters in which the Russell 2000 gained more than 20%, small caps have historically:
- Generated above average forward returns
- Finished higher 78% of the time, versus 67% across all quarters
- Tended to outperform large caps in the subsequent quarter and even more notably over the following 12 months
But perhaps the more interesting story is what drove the Q2 rally.
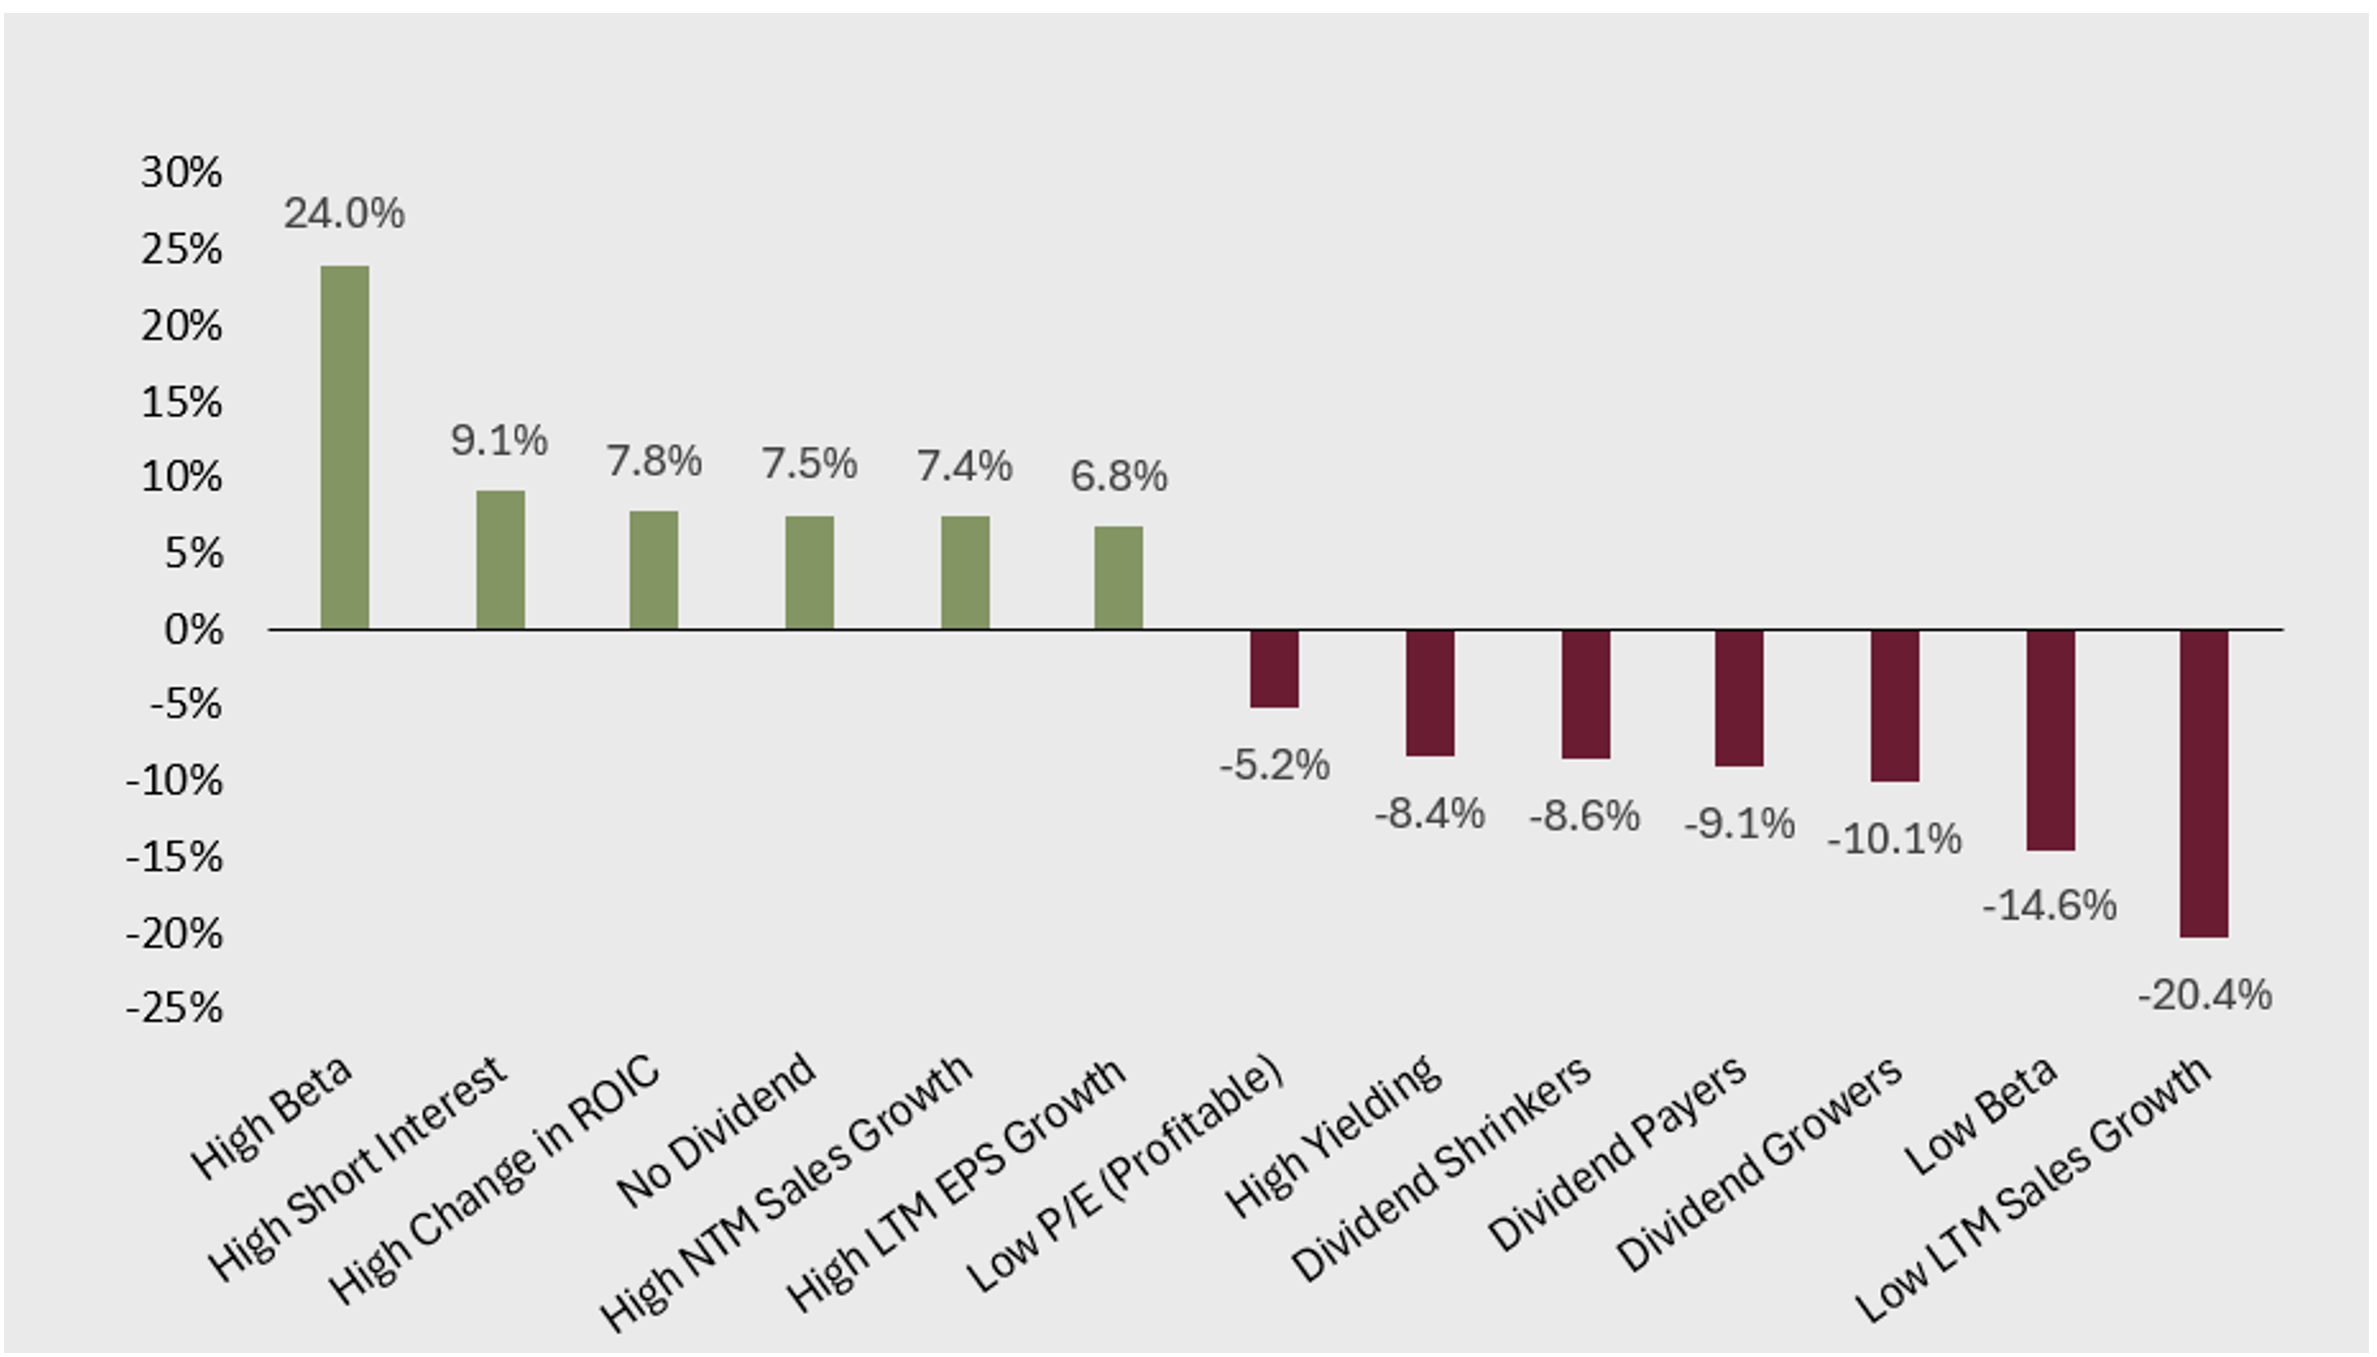
High beta stocks delivered their strongest relative performance within the Russell 2000 in a decade. Leadership also favored several lower quality and more speculative characteristics, including high short interest, non-dividend payers, and companies with high expected sales and earnings growth.
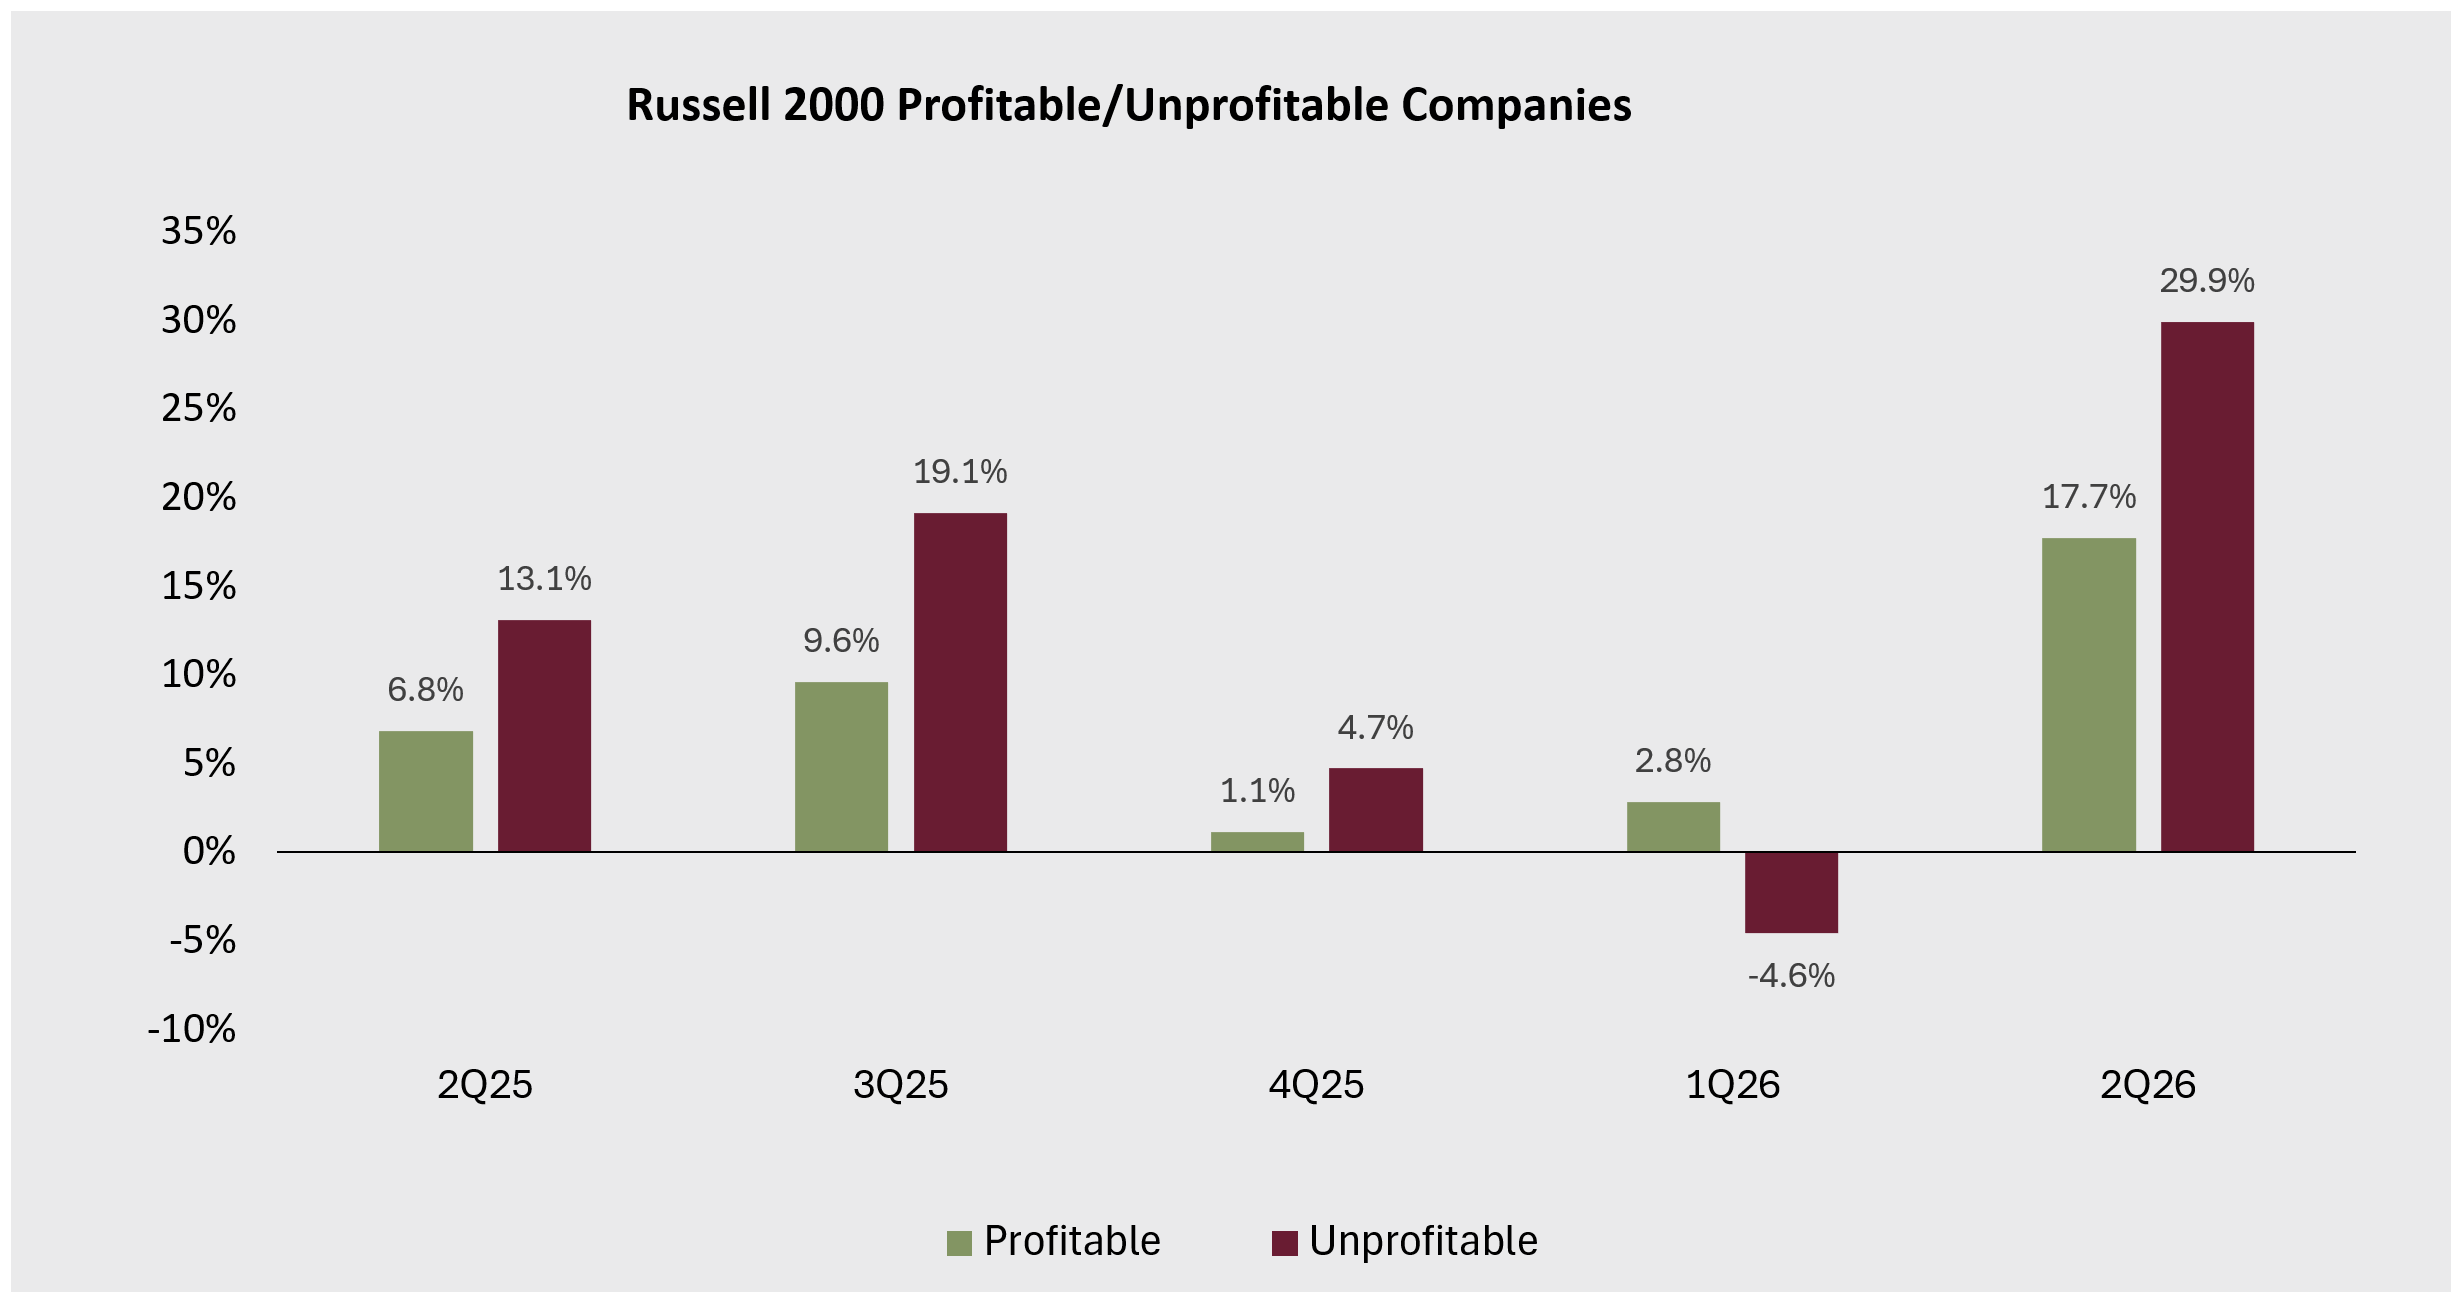
Most strikingly, non-earning companies outperformed profitable companies by more than 12% during the quarter.
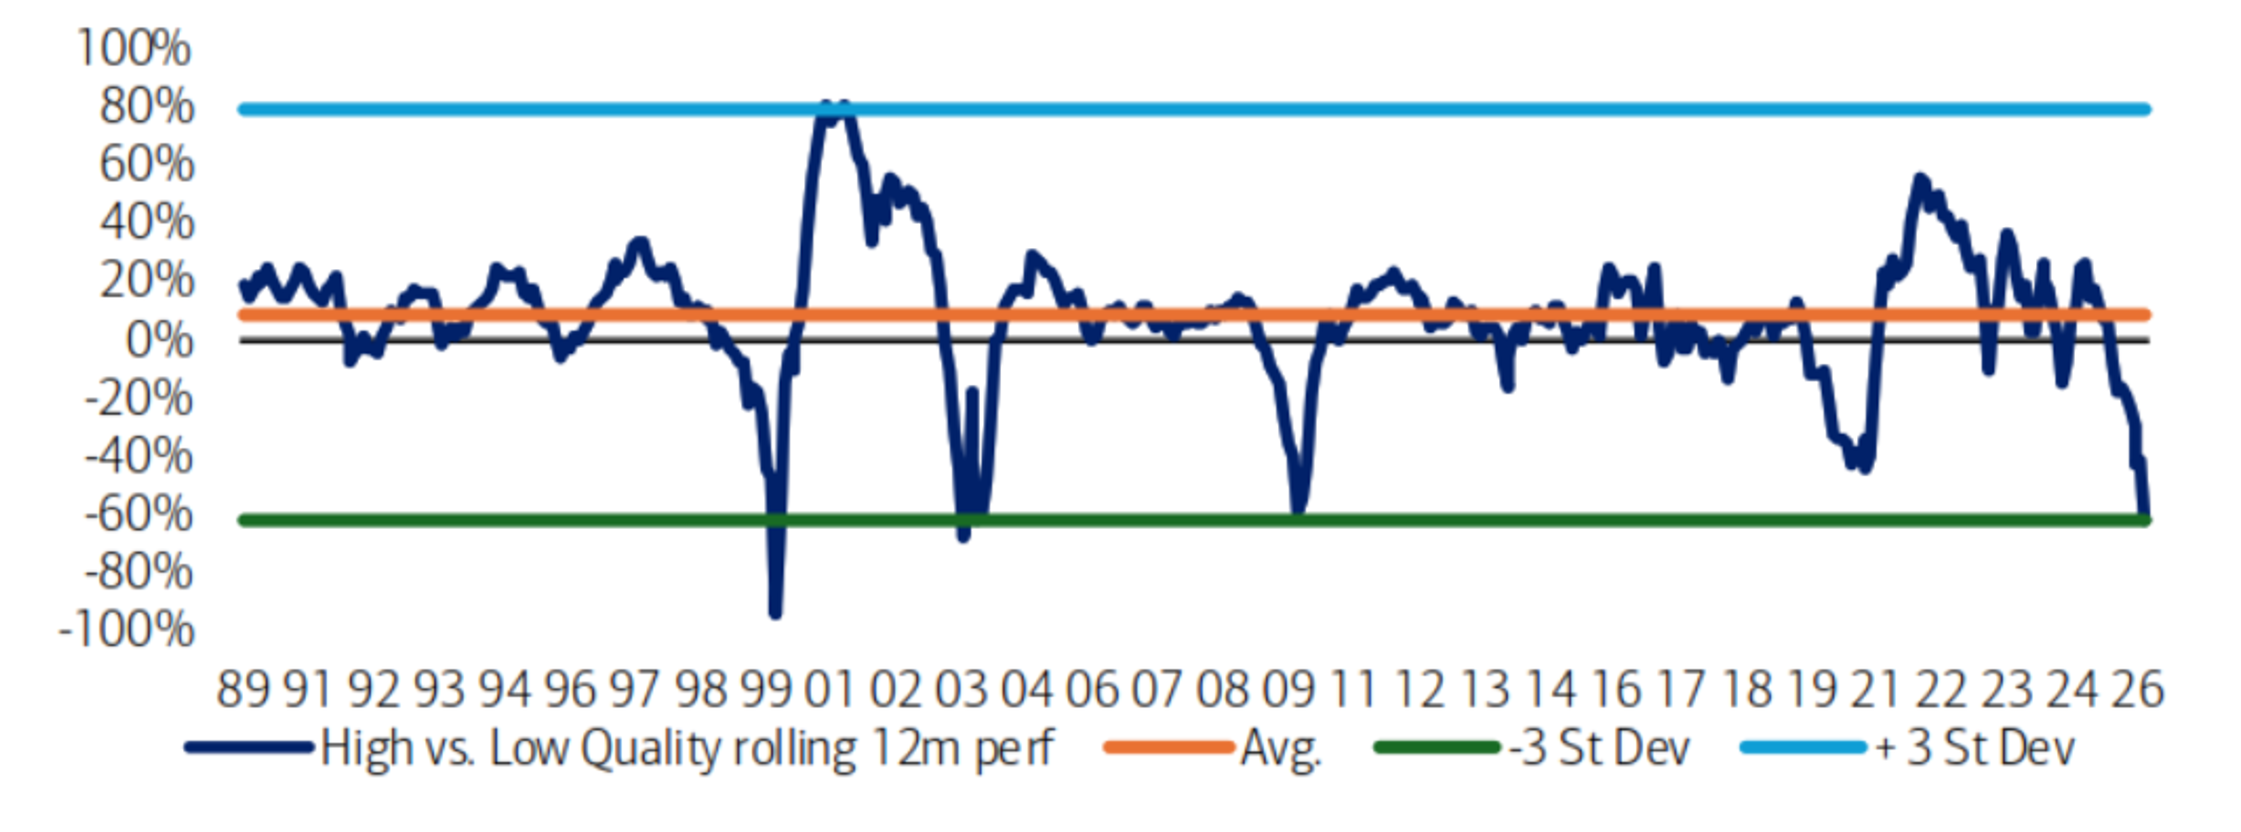
The divergence was also evident in profitability. The Russell 2000’s lowest ROIC quintile outperformed its highest ROIC quintile by a magnitude representing roughly a three standard deviation event on a 12-month rolling basis.
Historically, extremes like this have tended to mean revert over the following 6-12 months, with leadership shifting back toward higher quality businesses and companies generating stronger returns on invested capital.
Q2 rewarded risk taking. The question now is whether the next phase of the small cap rally rewards quality.
Explore our small caps observations for deeper insight.
2Q26 was the Russell 2000’s 8th Best Quarter since 1978
2Q26 was the Russell 2000’s best quarter since 4Q20, 8th best overall, and 23rd best on a relative basis.
Forward quarters following 20%+ quarters tend to be above average and up 78% of the time (versus 67% overall). Small caps also tend to outperform both in the forward quarter and particularly in the forward year.
Source: Furey Research Partners, FactSet; as of 6/30/2026.
Change in Leading Factors During 1H26
Low quality factors led in 2Q26
Source: Furey Research Partners, FactSet; Russell 2000 Index as of 6/30/2026.
Profitable vs. Unprofitable Companies
Quarterly Returns
Source: FactSet 4/01/2025 to 6/30/2026.
Outperformance of Low Quality at Historic Highs
Small Caps is at a 3 Standard Deviation Event
Historically, over the next 3/6/12 months, leadership changes and High Quality leads
Rolling 12-month relative performance of High vs Low Quality (Russell 2000 top/bottom quintile by ROIC)
Source: Bank of America, FactSet; 12/31/1989 to 6/30/2026.
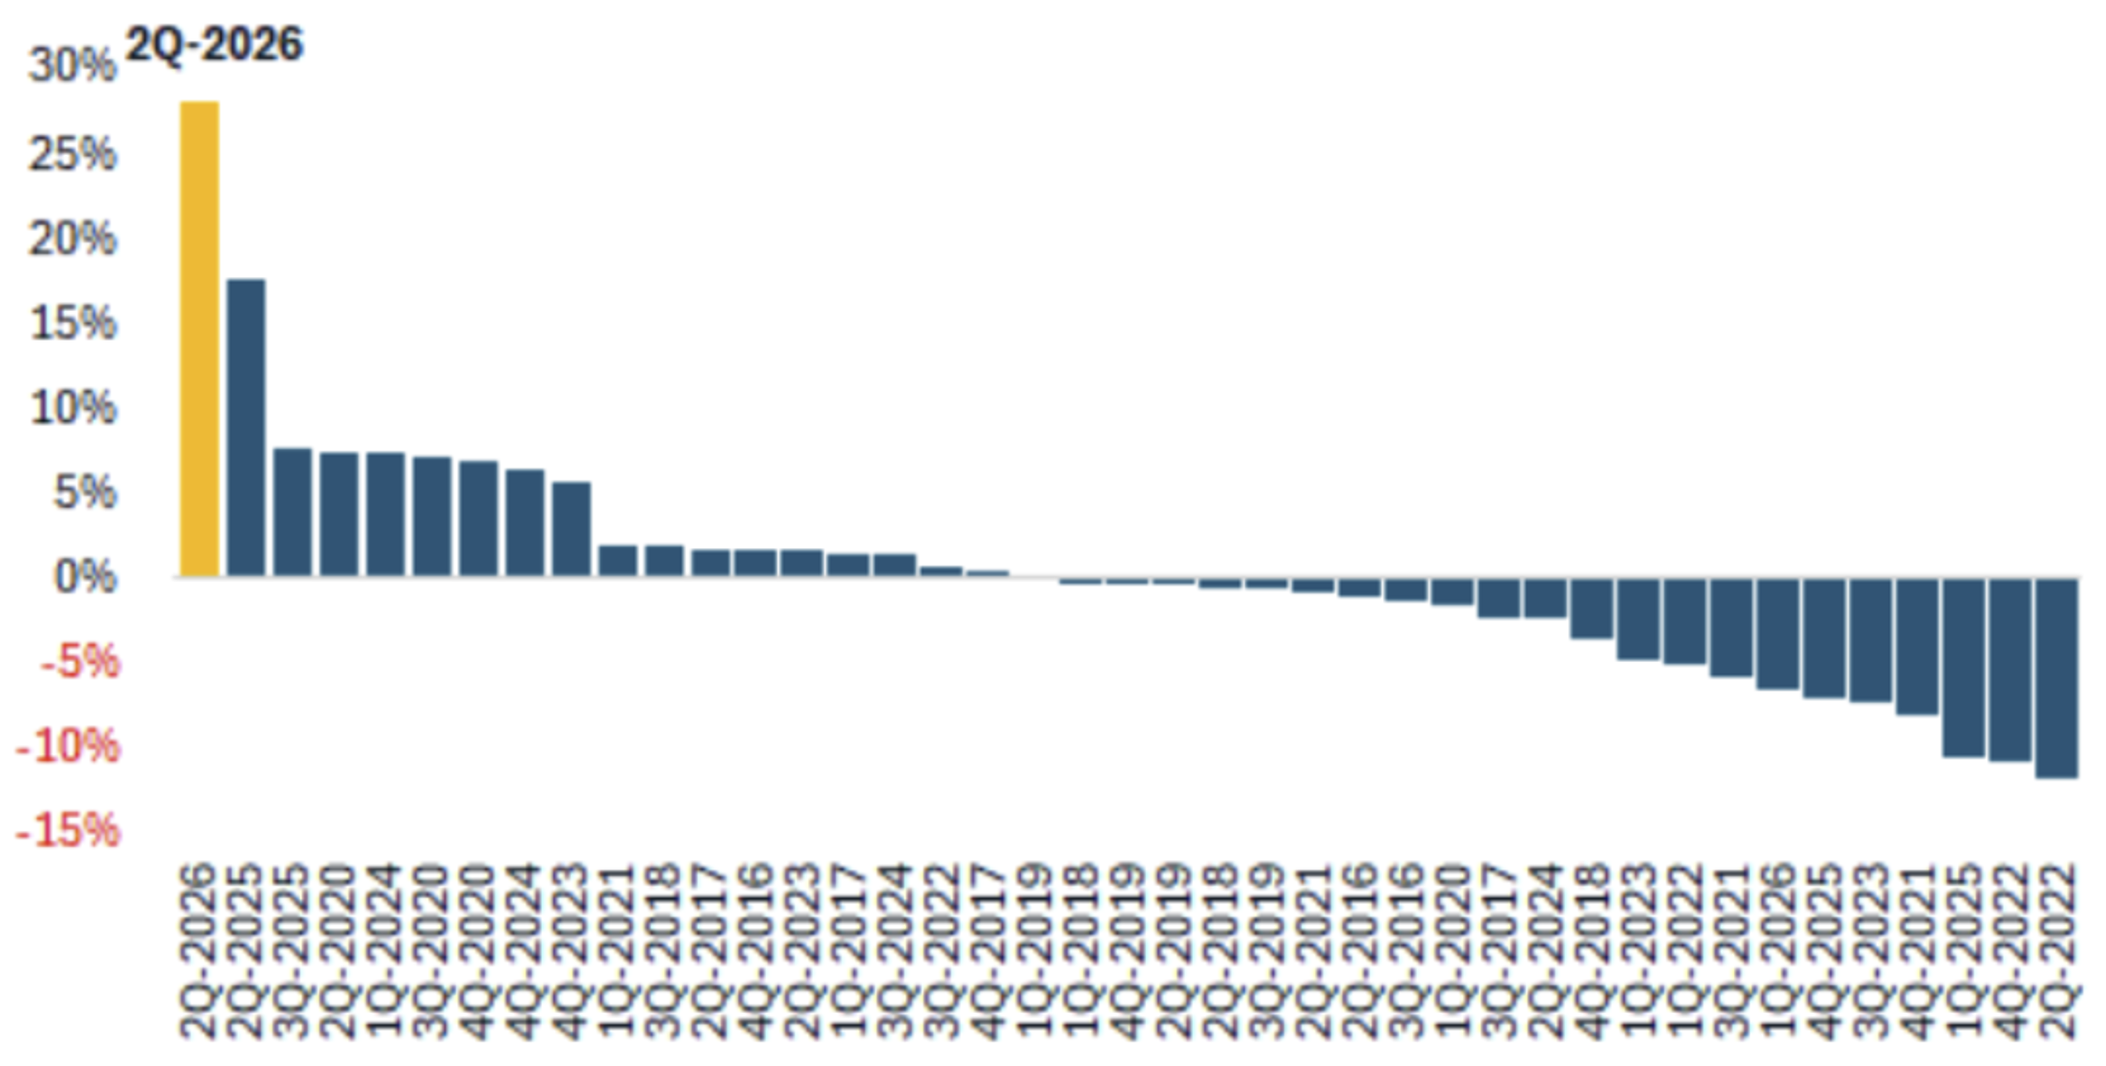
High Beta Surge During 2Q26
2Q26 was Beta’s best relative quarter within the Russell 2000 during the last 10 years
Source: Furey Research Partners, FactSet; Russell 2000 Index as of 6/30/2026.
For more small caps observations click here.
The opinions expressed herein are those of Aristotle Capital Boston (Aristotle Boston) and are subject to change without notice. This material is not financial advice or an offer to purchase or sell any product. Aristotle Boston reserves the right to modify its current investment strategies and techniques based on changing market dynamics or client needs.
All investments carry a certain degree of risk, including the possible loss of principal. Investments are also subject to political, market, currency and regulatory risks or economic developments. International investments involve special risks that may in particular cause a loss in principal, including currency fluctuation, lower liquidity, different accounting methods and economic and political systems, and higher transaction costs. These risks typically are greater in emerging markets. Securities of small- and medium-sized companies tend to have a shorter history of operations, be more volatile and less liquid. Value stocks can perform differently from the market as a whole and other types of stocks. The material is provided for informational and/or educational purposes only and is not intended to be and should not be construed as investment, legal or tax advice and/or a legal opinion. Investors should consult their financial and tax adviser before making investments. The opinions referenced are as of the date of publication, may be modified due to changes in the market or economic conditions, and may not necessarily come to pass. Information and data presented has been developed internally and/or obtained from sources believed to be reliable. Aristotle Boston does not guarantee the accuracy, adequacy or completeness of such information.
Past performance is not indicative of future results. The information provided in this report should not be considered financial advice or a recommendation to purchase or sell any particular security.
Differing historical time periods are selected throughout the presentation as we believe specific periods provide the most informative historical analog for the concepts presented.
The Russell 2000® Index measures the performance of the small cap segment of the U.S. equity universe. The Russell 2000 Index is a subset of the Russell 3000® Index representing approximately 10% of the total market capitalization of that index. It includes approximately 2000 of the smallest securities based on a combination of their market cap and current index membership. The volatility (beta) of the portfolios may be greater or less than the benchmark. It is not possible to invest directly in this index.
The S&P 500® Index is the Standard & Poor’s Composite Index and is a widely recognized, unmanaged index of common stock prices. It is market cap-weighted and includes 500 leading companies, capturing approximately 80% coverage of available market capitalization.
Aristotle Capital Boston, LLC is an independent investment adviser registered under the Investment Advisers Act of 1940, as amended. Registration does not imply a certain level of skill or training. More information about Aristotle Boston, including our investment strategies, fees and objectives, can be found in Form ADV Part 2, which is available upon request. ACB-2608-8