


Commentary
International Equity ADR WM 2Q 2026
(All MSCI index returns are shown net and in U.S. dollars unless otherwise noted.)
Markets Review
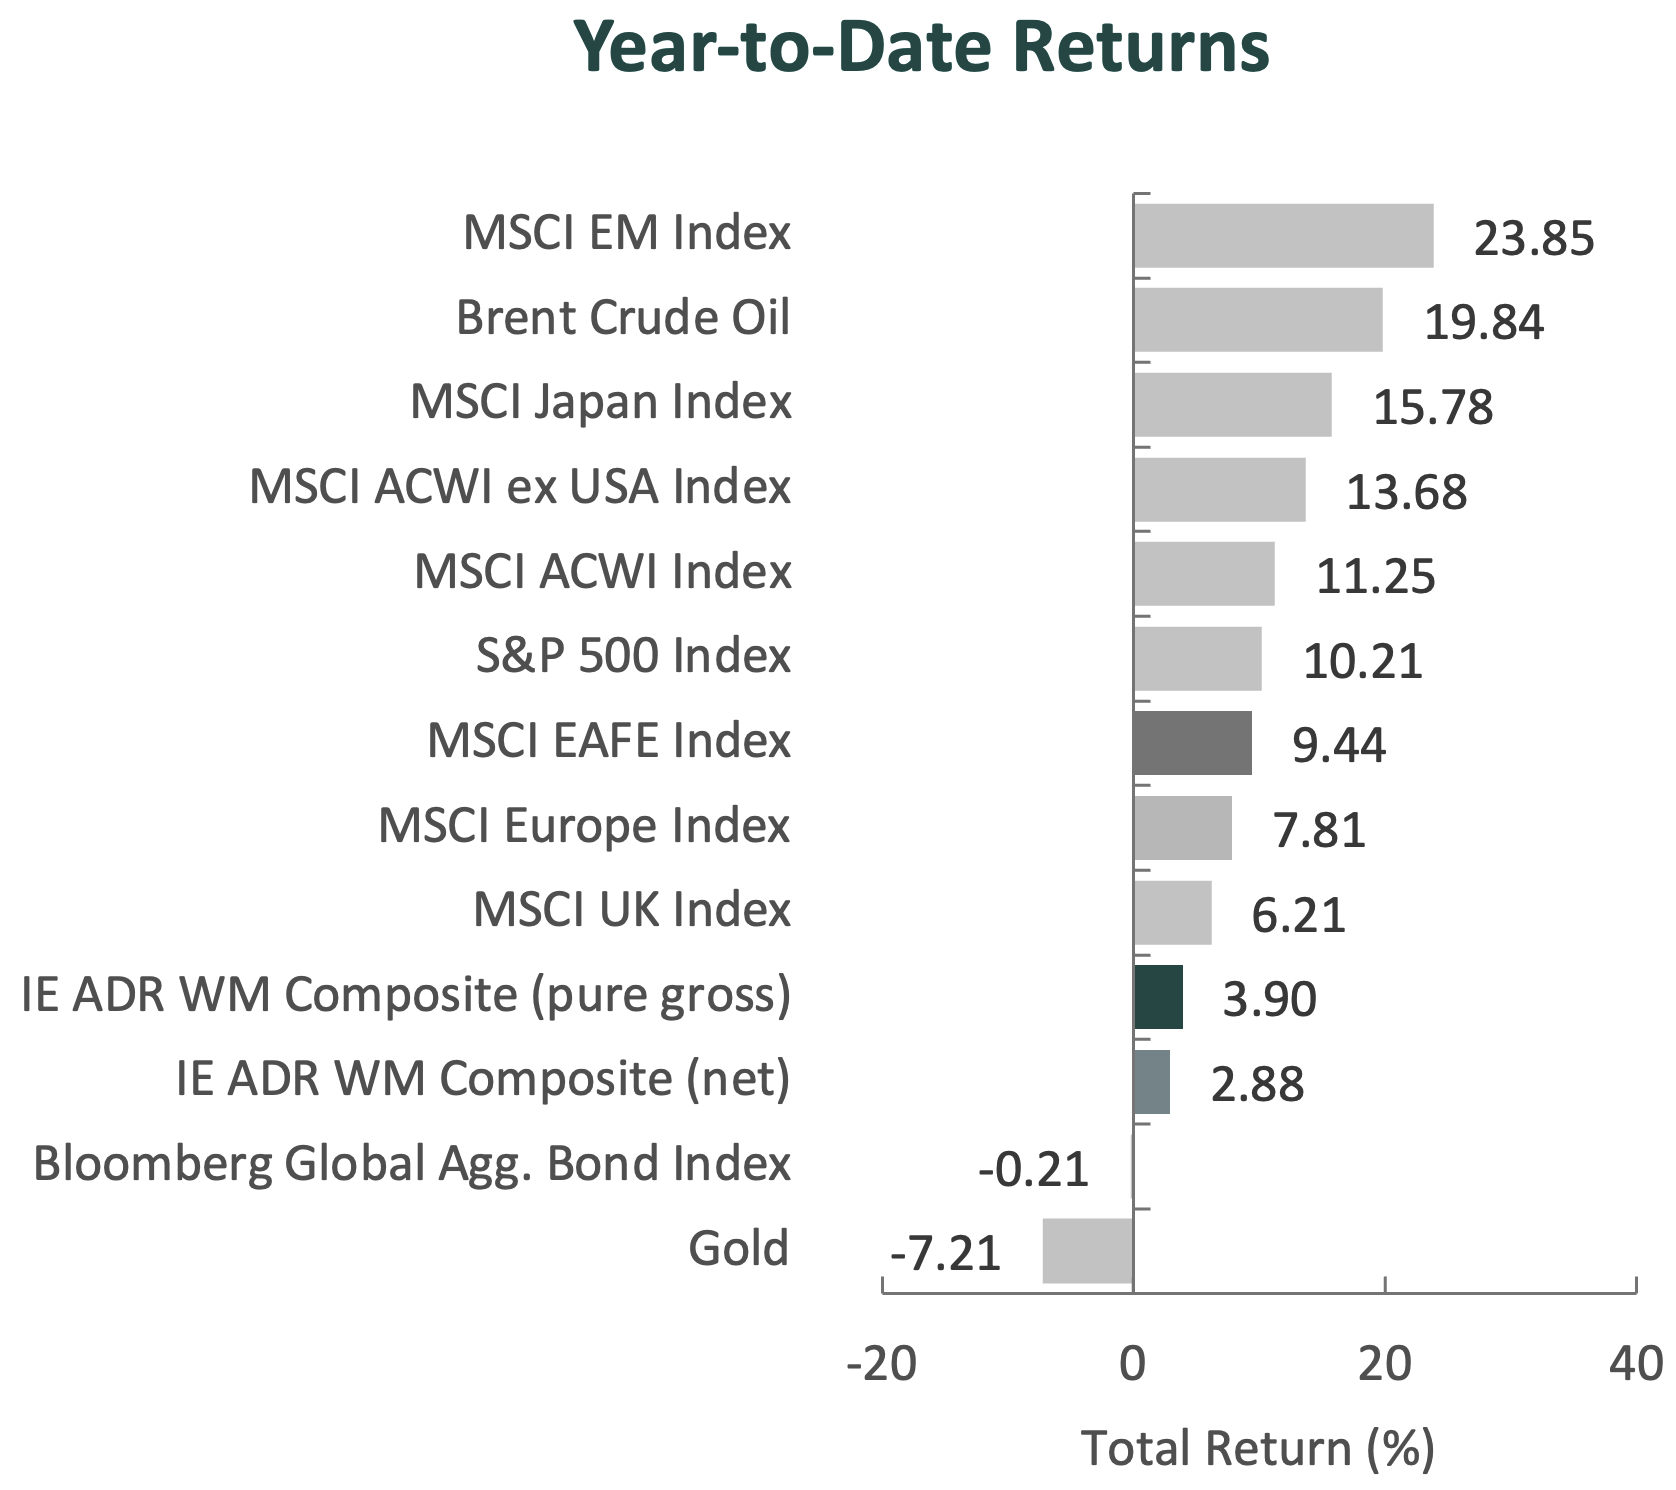
Sources: CAPS CompositeHubTM, Bloomberg
Past performance is not indicative of future results. Aristotle International Equity ADR WM Composite returns are presented pure gross and net of the maximum wrap fee and include the reinvestment of all income. Pure gross returns do not reflect the deduction of any trading costs or other fees and are supplemental to the net returns. Net returns are calculated by subtracting the highest applicable wrap/SMA fee, which includes trading costs and custodial fees, from the pure gross composite return (From inception to 12/31/2015, the highest applicable wrap/SMA fee is 3.00% on an annual basis, or 0.75% quarterly. From 1/1/2016 to 12/31/2023, the highest applicable wrap/SMA fee is 2.00% on an annual basis, or 0.50% quarterly and 0.17% monthly from 1/1/2024 to present.) Please see important disclosures at the end of this document.
Global equity markets rallied to record highs in the second quarter, with the MSCI ACWI Index rising 14.93% during the period. Global fixed income markets also advanced, as the Bloomberg Global Aggregate Bond Index increased 0.87%. From a style perspective, growth stocks outperformed value, with the MSCI ACWI Growth Index exceeding the MSCI ACWI Value Index by 9.21%.
The MSCI EAFE Index rose 10.82% during the period, while the MSCI ACWI ex USA Index climbed 14.49%. Within the MSCI EAFE Index, Europe & Middle East was the strongest performer, while the U.K. lagged. On a sector basis, nine out of the eleven sectors within the MSCI EAFE Index posted positive returns, with Information Technology, Financials, and Industrials performing the best. Conversely, Energy, Communication Services, and Utilities lagged.
Geopolitics remained a source of volatility, particularly in the Middle East, where the ongoing conflict between the U.S. and Iran affected energy markets, shipping routes, and investor sentiment. During the quarter, intermittent military strikes and recurring threats to commercial shipping in and around the Strait of Hormuz kept investors focused on the potential for disruptions to global energy supply. Late in the period, a temporary ceasefire and negotiations briefly eased these concerns. However, developments shortly after quarter-end, including renewed hostilities and President Trump’s statement that the ceasefire was over, underscored the fragility of the situation and the potential for renewed volatility in energy markets.
As the two sides worked toward peace, global economies continued to feel the negative impact of the war. Due to the inflationary shock from the conflict, the European Central Bank raised interest rates during the quarter; however, concerns about stagflation increased on news that real GDP growth in the eurozone had contracted versus the previous quarter. Meanwhile, the Bank of England and U.S. Federal Reserve kept rates steady, despite elevated inflation in both countries. In Asia, the Bank of Japan raised rates, and South Korea’s government passed a $17.7 billion emergency supplementary budget to offset rising oil prices.
Despite the fragile global economic backdrop, earnings in Europe and Asia remained robust, supported by continued demand tied to AI infrastructure and strength in select commodity-linked industries. Beneath the surface, market leadership reflected a more risk-on environment globally, with high-beta stocks generally outperforming low-beta stocks. Companies tied to the buildout of AI-related infrastructure, including semiconductors, memory, power equipment, and other data center suppliers, were among the strongest performers, while more defensive and lower-volatility areas generally lagged.
Performance and Attribution Summary
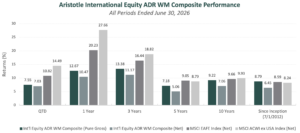
For the second quarter of 2026, Aristotle Capital’s International Equity ADR WM Composite posted a total return of 7.55% pure gross of fees (7.03% net of fees), underperforming the MSCI EAFE Index, which returned 10.82%, and the MSCI ACWI ex USA Index, which returned 14.49%. Please refer to the table below for detailed performance.
| Performance (%) | 2Q26 | YTD | 1 Year | 3 Years | 5 Years | 10 Years | Since Inception* |
|---|---|---|---|---|---|---|---|
| International Equity ADR WM Composite (pure gross) | 7.55 | 3.90 | 12.67 | 13.38 | 7.18 | 9.22 | 8.79 |
| International Equity ADR WM Composite (net) | 7.03 | 2.88 | 10.47 | 11.17 | 5.06 | 7.06 | 6.45 |
| MSCI EAFE Index (net) | 10.82 | 9.44 | 20.23 | 16.44 | 9.05 | 9.66 | 8.59 |
| MSCI ACWI ex USA Index (net) | 14.49 | 13.68 | 27.66 | 18.82 | 8.79 | 9.93 | 8.24 |
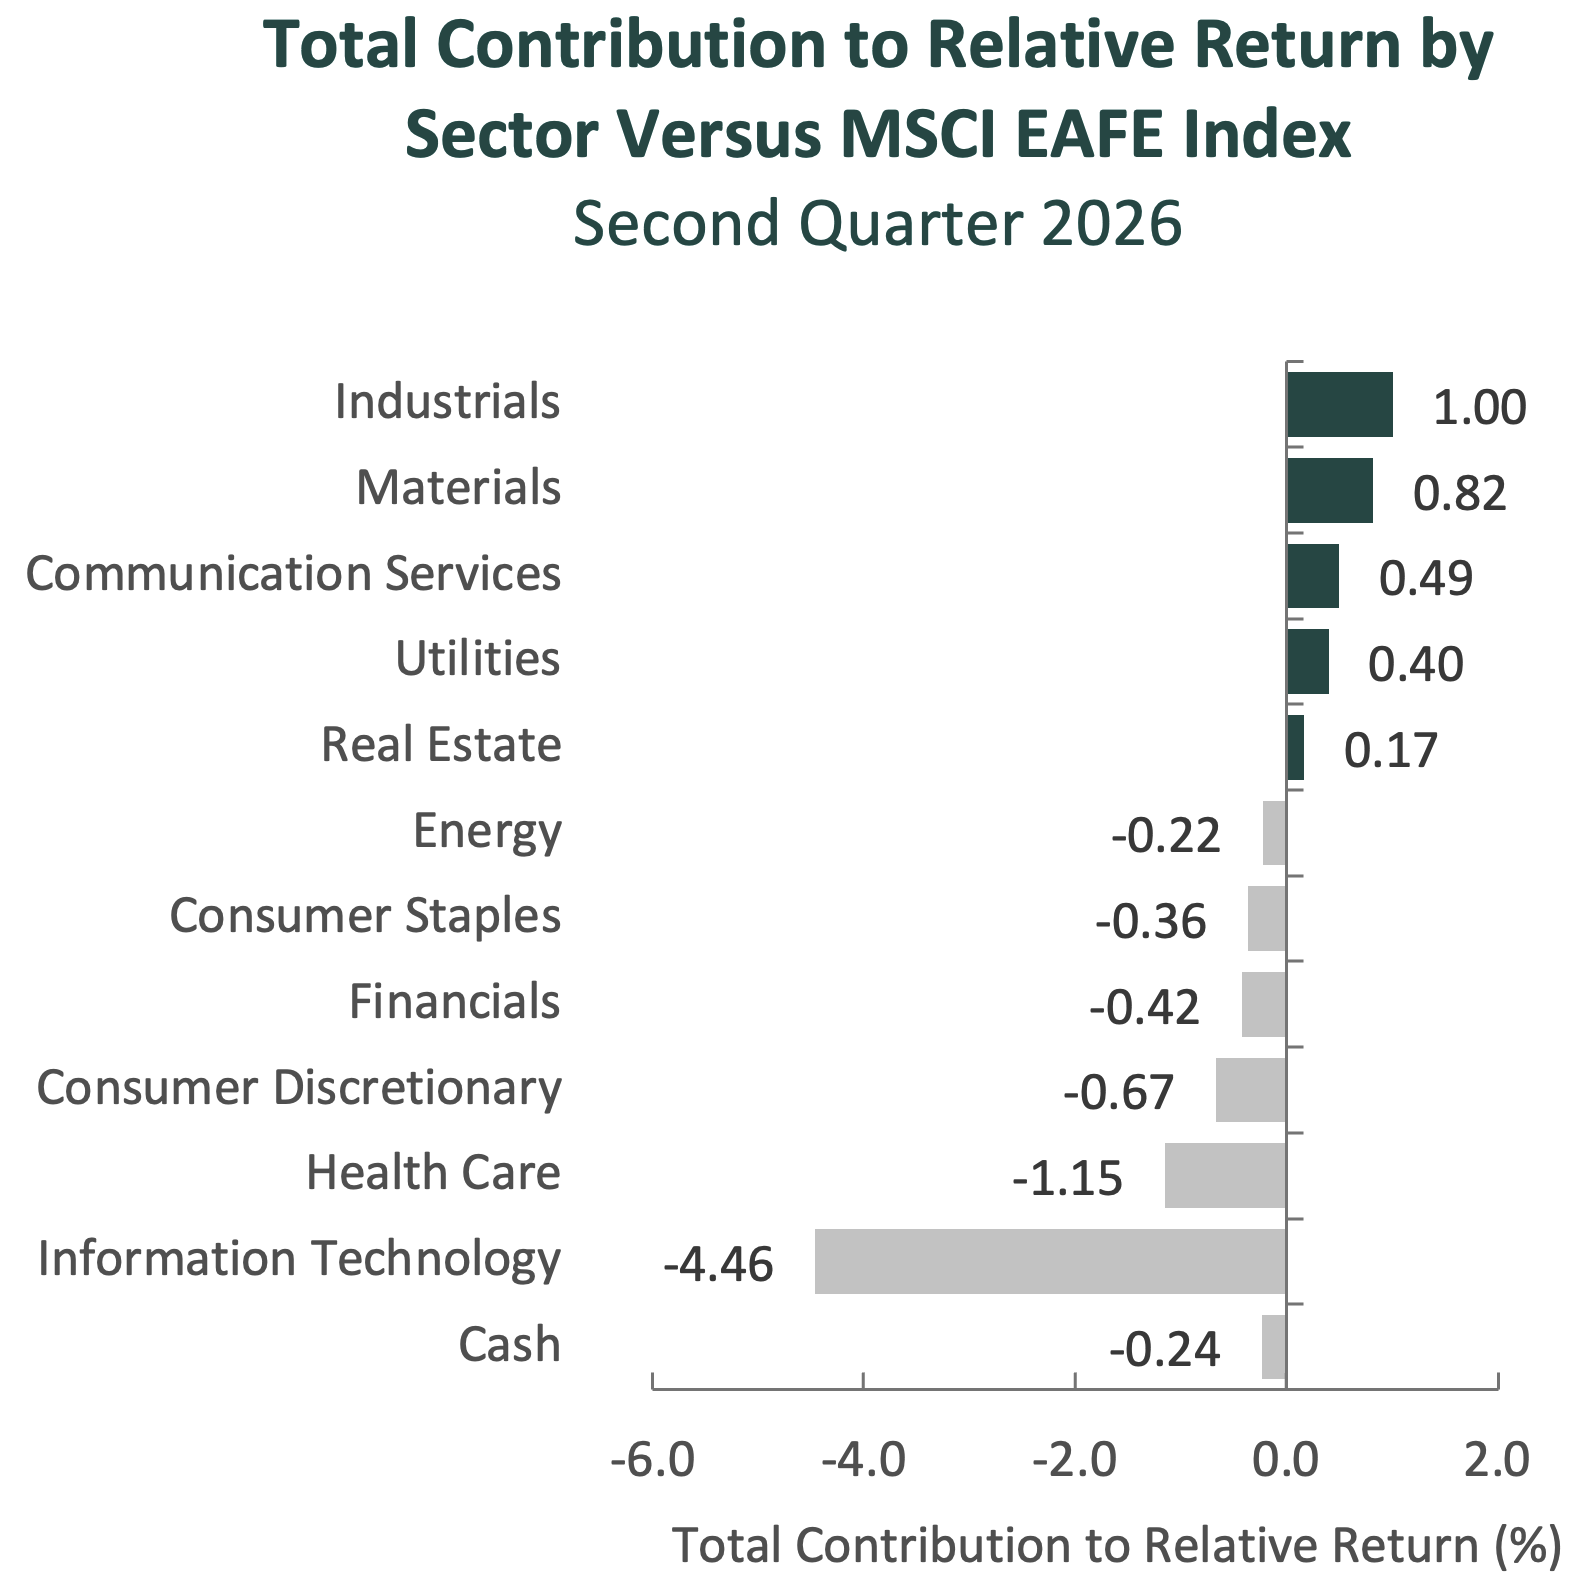
Source: FactSet
Past performance is not indicative of future results. Sector attribution shows how much of a portfolio’s overall return is directly attributable to stock selection and asset allocation decisions within the portfolio, highlighting which sectors contributed or detracted to the total return. Attribution includes the reinvestment of income. Attribution is presented gross of fees and does not include the deduction of all fees and expenses that a client or investor has paid or would have paid. Please refer to the pure gross and net composite returns included within to understand the overall impact of fees.
From a sector perspective, the portfolio’s underperformance relative to the MSCI EAFE Index can be attributed to security selection and allocation effects. Security selection and an underweight in Information Technology, as well as security selection in Health Care, detracted most from the portfolio’s relative performance. Conversely, security selection in Industrials, Materials, and Energy contributed to relative returns.
Regionally, both security selection and allocation effects were responsible for the portfolio’s underperformance. Security selection in Europe & Middle East and exposure to Canada detracted most from relative performance, while exposure to the U.S. and an underweight in the U.K. contributed.
Contributors and Detractors for 2Q 2026
| Relative Contributors | Relative Detractors |
|---|---|
| Erste Group Bank | Pan Pacific International |
| ING Groep | Accenture |
| Fast Retailing | Cameco |
| Techtronic Industries | Wal-Mart de Mexico |
| Credicorp | Munich Reinsurance |
Relative contributors and detractors are based on attribution total effect and exclude benchmark securities not held in the portfolio.
Pan Pacific International Holdings, the Japanese discount retailer, was the largest detractor during the period. Shares declined as investors weighed the company’s acquisition of Tokyo metropolitan supermarket chain Olympic Group, the potential upfront costs associated with its new Robin Hood format, and broader concerns about gross margin sustainability in a competitive retail environment. Management also announced leadership changes at Gelson’s, its California-based premium grocery subsidiary, as the business works to improve operating performance amid a more challenging consumer backdrop. Nevertheless, we believe Pan Pacific’s long-term investment case remains intact. The company continues to benefit from differentiated store formats, decentralized merchandising, strong value positioning, as well as management’s experience improving acquired retail assets. Same-store sales in the discount store business remain strong, while private-label expansion, UNY margin improvement, and new concepts such as Robin Hood and Rail-side Donki extend the company’s domestic growth runway. We remain confident that Pan Pacific’s distinctive retail culture and disciplined execution position it well for long-term growth.
Accenture, the global provider of IT consulting and technology services, was a primary detractor during the quarter. Shares declined as investors reacted to weaker bookings, a lower revenue outlook, continued pressure on discretionary IT spending, and disruptions tied to the conflict in the Middle East, while also debating whether generative AI could reduce demand for traditional consulting services. Despite these near-term headwinds, Accenture remains a premier enterprise transformation partner, with advantages rooted in scale, deep industry expertise, broad technology partnerships, and long-standing client relationships. Management continued to highlight growing demand for large-scale AI reinvention programs as clients move from experimentation to production, with AI increasingly embedded in broader managed services contracts. The company also expanded its capabilities through the acquisitions of Dragos, runZero, and NetRise, building a leading operational technology cybersecurity platform with more software- and platform-oriented revenue streams. In addition, Accenture Edge, supported by Microsoft and Avanade, extends the company’s reach into the underpenetrated mid-market. We believe these initiatives reinforce Accenture’s ability to adapt to technology shifts and sustain its long-term competitive position.
Fast Retailing, the Japanese multinational apparel retailer and owner of UNIQLO, was a leading contributor during the quarter. Shares rose sharply after the company reported another strong quarter and raised full-year revenue and profit guidance, as strength across UNIQLO’s global business more than offset headwinds from higher sourcing costs and softer inbound tourism in Japan. Results were supported by continued demand for year-round LifeWear products, successful flagship store execution, operating efficiency gains, and improving performance in Greater China—where the company’s shift toward more localized, independent store management appears to be gaining traction. The quarter also reinforced several aspects of our quality thesis. UNIQLO’s differentiated model, focused on functional, high-quality everyday apparel at attractive prices, continues to benefit from scale, disciplined SKU management, long-standing supplier partnerships, and strong brand equity. These advantages have allowed the company to generate attractive returns while expanding globally from a Japanese retailer into one of the world’s leading apparel platforms. The results also demonstrated progress against catalysts we have identified, including the China turnaround, further global expansion of UNIQLO (particularly in North America and Europe) and improving execution at GU. We were also encouraged by evidence that the company’s U.S. success is being driven not simply by store openings, but by deeper brand building, localized management, and investment in training and culture, which may support a longer runway for profitable growth.
Techtronic Industries, the Hong Kong-based manufacturer of power tools, was a primary contributor during the period. We initiated our investment in the first quarter of 2026, attracted to the company’s Milwaukee and Ryobi brands, culture of product innovation, and battery ecosystems that create loyalty and repeat purchases across hundreds of compatible tools. Recent results highlight the company’s progress, with Milwaukee driving revenue growth through deeper penetration of professional trades, new product introductions, and expansion into additional geographies, while Ryobi remains a leading DIY platform with opportunities to expand beyond its core markets. The company has also improved the quality of its earnings base by shifting further toward Milwaukee, exiting lower-return areas such as HART and rationalizing underperforming product lines. Importantly, the business is increasingly broader than residential repair and remodel demand. Milwaukee is becoming embedded in the workflows of mechanical, electrical, and plumbing contractors working on data centers, grid infrastructure, and other complex non-residential projects, where productivity, safety, and uptime are critical. This is a natural extension of Techtronic’s strategy: expand the Milwaukee ecosystem around the jobsite, then deepen customer loyalty through batteries, accessories, personal protective equipment, storage, and service support that can make the platform more valuable over time.
Recent Portfolio Activity
| Buys | Sells |
|---|---|
| Magnum Ice Cream | Unilever |
During the quarter, we sold our position in Unilever and invested in Magnum Ice Cream.
We first invested in Unilever, the global consumer staples company, in the second quarter of 2013. We have long been attracted to the company’s broad portfolio of leading personal care and food brands (such as Dove, Knorr, and Axe), global scale, significant emerging markets exposure, and strong position across everyday use categories. Over our more than decade-long holding period, Unilever strengthened and simplified its portfolio, divesting lower-growth food assets, improving efficiency, increasing focus behind its largest brands, and shifting the business toward faster-growing, higher-margin beauty, wellbeing, personal care, and home care categories. More recently, the separation of the ice cream business and continued reshaping of the food portfolio have further narrowed Unilever’s strategic focus. While we continue to view the remaining Unilever franchise as high quality, we believe the more compelling opportunity now resides in the independent ice cream business, where dedicated management and a category-specific strategy should provide a clearer path to value creation. We therefore elected to exit Unilever and redeploy the proceeds into Magnum Ice Cream, discussed in greater detail below.
The Magnum Ice Cream Company N.V.
Headquartered in Amsterdam, the Netherlands, Magnum Ice Cream is the world’s largest dedicated ice cream manufacturer. The company was formed following its separation from Unilever in 2025 and owns a portfolio of leading global, regional, and local brands, including Magnum, Ben & Jerry’s, Cornetto, Wall’s, Breyers, Klondike, Popsicle, Talenti, and Yasso. Collectively, these brands generate more than €8 billion in annual revenue, are sold across roughly 80 countries, and span a wide range of price points, formats, and consumption occasions.
Magnum sells products through both at-home and away-from-home channels. The at-home business includes pints, tubs, and multipacks sold through grocery, club, and other retail stores, while the away-from-home business consists primarily of single-serve products sold through a global network of approximately three million freezer cabinets. Supporting this distribution model is one of the most extensive cold-chain networks in the consumer staples industry, including more than 30 manufacturing facilities, 200 warehouses, and over 2,000 distributors. Following its separation from Unilever, Magnum is now focused exclusively on frozen desserts, allowing management to optimize sales, marketing, innovation, and supply chain decisions around the unique dynamics of the ice cream category.
High-Quality Business
Some of the quality characteristics we have identified for Magnum include:
- The global market leader in ice cream, with approximately 21% market share and ownership of four of the five largest ice cream brands worldwide;
- A portfolio of iconic brands that benefit from strong consumer recognition, pricing power and customer loyalty;
- A premium-oriented portfolio, with approximately 80% of revenue generated from premium products and pricing that is roughly 2.5x higher per kilogram than private label competitors;
- A difficult-to-replicate global cold-chain distribution network, including three million freezer cabinets that improve product availability and support impulse purchases in the away-from-home channel; and
- Strong returns on invested capital, supported by leading market positions, premium products, and significant scale advantages across procurement, manufacturing, and distribution.
Attractive Valuation
Historically, the ice cream business operated within Unilever’s broader portfolio, where it lacked a dedicated sales force and was supported by a supply chain optimized for a diverse mix of consumer products rather than the unique requirements of frozen desserts. This contributed to lower factory utilization, underinvestment in certain markets, and suboptimal retailer negotiations. In addition, one-time separation costs and transitional service agreements have weighed on current profitability following the company’s separation from Unilever.
At approximately 11x our estimate of normalized earnings, we believe shares do not fully reflect Magnum’s leading global market position, premium brand portfolio, and ability to generate attractive returns on invested capital.
Compelling Catalysts
Catalysts we have identified for Magnum, which we believe will cause its stock price to appreciate over our three- to five-year investment horizon, include:
- Expansion of its global freezer cabinet fleet, improving product availability, and supporting market share gains in the attractive away-from-home channel;
- Continued premiumization of its portfolio through innovation, new product formats, and increased penetration of higher-value brands such as Magnum, Ben & Jerry’s, and Yasso;
- Expansion into new formats, including Yasso handhelds, Ben & Jerry’s handhelds, and Magnum BonBons, which should increase consumption occasions and support mix improvement;
- Supply chain optimization initiatives, including a transition toward more localized manufacturing and distribution, which should improve operating margins and capacity utilization;
- Increased focus and investment following its separation from Unilever, including a dedicated sales force, category-specific retailer negotiations, and a commercial strategy designed specifically for frozen desserts; and
- Market share recovery opportunities in key geographies, including India, where Magnum acquired a majority stake in Kwality Wall’s. The business had previously lost meaningful share due to poor management, insufficient manufacturing and distribution investment, pricing missteps, and the removal of dairy from certain products.
Conclusion
As we look ahead, the global backdrop remains complex. Geopolitical developments, central bank decisions and changes in investor risk appetite can all influence returns over shorter periods, but these factors are difficult to forecast with consistency. Rather than position the portfolio around macro outcomes, we continue to focus on the businesses we own and the actions management teams are taking to increase value over time.
Our investment process centers on the three pillars of Quality, Valuation and Catalysts. We seek companies with strong competitive positions, capable management teams, financial resilience and identifiable opportunities to improve profitability and FREE cash flow. While markets can move quickly from one theme to the next, we believe owning high-quality businesses at attractive valuations remains the best way to create value for clients over the long term.
The opinions expressed herein are those of Aristotle Capital Management, LLC (Aristotle Capital) and are subject to change without notice. Past performance is not a guarantee or indicator of future results. This material is not financial advice or an offer to buy or sell any product. You should not assume that any of the securities transactions, sectors or holdings discussed in this report were or will be profitable, or that recommendations Aristotle Capital makes in the future will be profitable or equal the performance of the securities listed in this report. The portfolio characteristics shown relate to the Aristotle International Equity ADR strategy. Not every client’s account will have these characteristics. Aristotle Capital reserves the right to modify its current investment strategies and techniques based on changing market dynamics or client needs. There is no assurance that any securities discussed herein will remain in an account’s portfolio at the time you receive this report or that securities sold have not been repurchased. The securities discussed may not represent an account’s entire portfolio and, in the aggregate, may represent only a small percentage of an account’s portfolio holdings. The performance attribution presented is of a representative account from Aristotle Capital’s International Equity ADR strategy. The representative account is a discretionary client account which was chosen to most closely reflect the investment style of the strategy. The criteria used for representative account selection is based on the account’s period of time under management and its similarity of holdings in relation to the strategy. Recommendations made in the last 12 months are available upon request.
Composite returns are presented pure gross and net of the maximum wrap fee and include the reinvestment of all income. Pure gross returns do not reflect the deduction of any trading costs or other fees and are supplemental to the net returns. Net returns are calculated by subtracting the highest applicable wrap/SMA fee, which includes trading costs and custodial fees, from the pure gross composite return. (From inception to 12/31/2015, the highest applicable wrap/SMA fee is 3.00% on an annual basis, or 0.75% quarterly. From 1/1/2016 to 12/31/2023, the highest applicable wrap/SMA fee is 2.00% on an annual basis, or 0.50% quarterly and 0.17% monthly from 1/1/2024 to present.)
All investments carry a certain degree of risk, including the possible loss of principal. Investments are also subject to political, market, currency and regulatory risks or economic developments. International investments involve special risks that may in particular cause a loss in principal, including currency fluctuation, lower liquidity, different accounting methods and economic and political systems, and higher transaction costs. These risks typically are greater in emerging markets. While Large-capitalization companies may have more stable prices than smaller, less established companies, they are still subject to equity securities risk. In addition, large-capitalization equity security prices may not rise as much as prices of equity securities of small-capitalization companies. Securities of small- and medium-sized companies tend to have a shorter history of operations and be more volatile and less liquid. Value stocks can perform differently from the market as a whole and other types of stocks. The material is provided for informational and/or educational purposes only and is not intended to be and should not be construed as investment, legal or tax advice and/or a legal opinion. Investors should consult their financial and tax adviser before making investments. The opinions referenced are as of the date of publication, may be modified due to changes in the market or economic conditions, and may not necessarily come to pass. Information and data presented has been developed internally and/or obtained from sources believed to be reliable. Aristotle Capital does not guarantee the accuracy, adequacy or completeness of such information.
Aristotle Capital Management, LLC is an independent registered investment adviser under the Advisers Act of 1940, as amended. Registration does not imply a certain level of skill or training. More information about Aristotle Capital, including our investment strategies, fees and objectives, can be found in our Form ADV Part 2, which is available upon request. ACM-2607-72
Sources: CAPS CompositeHubTM, MSCI
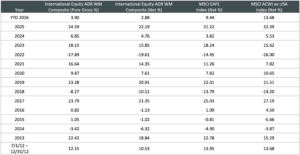
Past performance is not indicative of future results. The information provided should not be considered financial advice or a recommendation to purchase or sell any particular security or product. Performance results for periods greater than one year have been annualized.
The Aristotle International Equity ADR WM Composite has an inception date of 7/1/2012. As of 1/1/2024, the Composite was renamed from the International Equity ADR Wrap Composite.
Composite returns are presented pure gross and net of the maximum wrap fee and include the reinvestment of all income. Pure gross returns do not reflect the deduction of any trading costs or other fees and are supplemental to the net returns. Net returns are calculated by subtracting the highest applicable wrap/SMA fee, which includes trading costs and custodial fees, from the pure gross composite return. (From inception to 12/31/2015, the highest applicable wrap/SMA fee is 3.00% on an annual basis, or 0.75% quarterly. From 1/1/2016 to 12/31/2023, the highest applicable wrap/SMA fee is 2.00% on an annual basis, or 0.50% quarterly and 0.17% monthly from 1/1/2024 to present.)
The MSCI EAFE Index (Europe, Australasia, Far East) is an equity index which captures large and mid cap representation across Developed Markets (DM) countries around the world, excluding the US and Canada. The index covers approximately 85% of the free float-adjusted market capitalization in each country. The MSCI ACWI Index captures large and mid cap representation across Developed Markets (DM) and Emerging Markets (EM) countries. The index covers approximately 85% of the global investable equity opportunity set. The MSCI ACWI ex USA Index captures large and mid cap representation across Developed Markets (DM) countries (excluding the US) and Emerging Markets (EM) countries. The index covers approximately 85% of the global equity opportunity set outside the United States. The MSCI Emerging Markets Index captures large and mid cap representation across Emerging Markets countries. The index covers approximately 85% of the free float-adjusted market capitalization in each country. The MSCI ACWI Value Index captures large and mid cap securities exhibiting overall value style characteristics across Developed Markets (DM) and Emerging Markets (EM) countries. The S&P 500 Index is the Standard & Poor’s Composite Index and is a widely recognized, unmanaged index of common stock prices. It is market cap weighted and includes 500 leading companies, capturing approximately 80% coverage of available market capitalization. The Brent Crude Oil Index is a major trading classification of sweet light crude oil that serves as a major benchmark price for purchases of oil worldwide. The MSCI Japan Index is designed to measure the performance of the large and mid-cap segments of the Japanese market. With approximately 200 constituents, the Index covers approximately 85% of the free float-adjusted market capitalization in Japan. The Bloomberg Global Aggregate Bond Index is a flagship measure of global investment grade debt from 28 local currency markets. This multi-currency benchmark includes treasury, government-related, corporate and securitized fixed-rate bonds from both developed and emerging markets issuers. The MSCI United Kingdom Index is designed to measure the performance of the large and mid-cap segments of the U.K. market. With nearly 100 constituents, the Index covers approximately 85% of the free float-adjusted market capitalization in the United Kingdom. The MSCI Europe Index captures large and mid cap representation across Developed Markets (DM) countries in Europe. The Index covers approximately 85% of the free float-adjusted market capitalization across the European Developed Markets equity universe. These indexes have been selected as the benchmarks and are used for comparison purposes only. The volatility (beta) of the Composite may be greater or less than the respective benchmarks. It is not possible to invest directly in these indexes.