
Merrill Lynch
International Equity ADR 4Q 2021
FOR PRESENTATION TO MERRILL LYNCH WEALTH MANAGEMENT FINANCIAL ADVISORS ONLY
(All MSCI index returns are shown net and in U.S. dollars unless otherwise noted.)
Markets Review
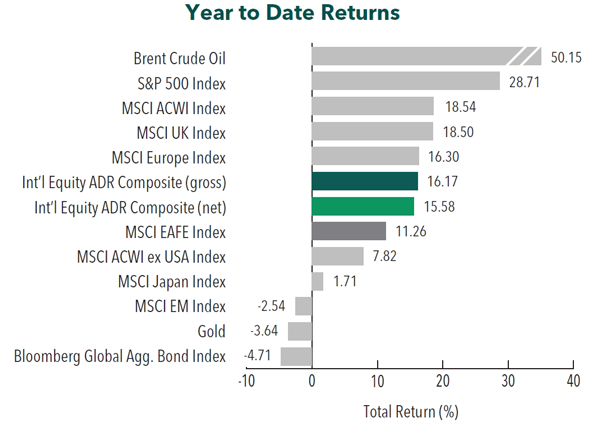
Global Markets (total return) performed as follows:
Sources: SS&C Advent, Bloomberg
Past performance is not indicative of future results. Aristotle International Equity ADR Composite returns are presented gross and net of investment advisory fees and include the reinvestment of all income. Aristotle Capital Composite returns are preliminary pending final account reconciliation. Please see important disclosures at the end of this document.
After declining in the third quarter of 2021, global equity markets rebounded during the fourth quarter. Overall, the MSCI ACWI Index climbed 6.68% during the period, which brings its full-year return to 18.54%. Concurrently, the Bloomberg Global Aggregate Bond Index pulled back 0.67%, which gives the Index a calendar-year return of -4.71%. In terms of style, value stocks underperformed their growth counterparts during the quarter, with the MSCI ACWI Value Index trailing the MSCI ACWI Growth Index by 0.67%. However, for the full year, the MSCI ACWI Value outperformed the MSCI ACWI Growth by 2.52%.
The MSCI EAFE Index rose 2.69% during the fourth quarter, while the MSCI ACWI ex USA Index gained 1.82%. Regionally, the U.K. and Europe & Middle East were the strongest performers, while Asia was the weakest. On a sector basis, nine out of the eleven sectors within the MSCI EAFE Index posted positive returns, led by Utilities, Materials and Consumer Staples. Conversely, Communication Services, Energy and Real Estate were the worst-performing sectors.
Similar to previous quarters, investors focused on the progress of the global recovery. Although corporate revenues and earnings continued to rebound during the period, the IMF announced a slight downward revision to its 2021 global real GDP growth projections due to continued supply disruptions and uncertain pandemic dynamics. These conditions have caused shortages of key inputs, lowered manufacturing activity and fueled inflation across the globe.
In addition to a global shipping crisis and semiconductor shortages, the energy sector also captured numerous headlines as robust demand outpaced supply, causing prices to surge. After a historic drop in energy consumption in 2020, the global economic recovery and a long and cold winter in the Northern Hemisphere have driven a strong rebound in demand, while the ongoing shift to renewables has impacted production and future investments in fossil fuels. Although OPEC and countries such as Russia have pledged to boost supply, the energy crunch has highlighted issues in long-term production. Furthermore, rising energy prices have contributed to an inflation loop as the prices of energy-intensive materials like nickel, steel and silicon have all risen.
Increased inflation, combined with an uncertain recovery, has created policy challenges for central banks. On one hand, the rhetoric on inflation being “transitory” softened as many central banks took a hawkish approach. During the quarter, the European Central Bank announced a gradual phaseout of its bond purchase program, while countries like the U.K., Russia and Mexico raised interest rates. On the other hand, policy in Southeast Asia was largely unchanged, and China announced an easing of its monetary policy that will likely include further cuts to lending rates.
On the COVID front, the Omicron variant became the dominant strain in areas such as the U.K. and the U.S. The number of new daily cases reached as high as ~1,750,000, the highest reported figure during the pandemic, with Europe and the Americas reporting the greatest number of cases.
Annual Markets Review
In a year filled with uncertainty, global economies proved largely resilient. Even in the face of supply-chain disruptions and multiple variants of the COVID-19 virus, global recovery continued throughout the period. Themes from 2020, such as central bank policy decisions and vaccine distribution, persisted.
Although we are happy to report another strong year, the constant twists, turns and pivots of this past year are a reminder of the fragility of the short term. Factors such as the possibility of new variants, the timing of a full recovery, fiscal and monetary policy decisions, and market sentiment are topics better left for reporters. We believe investment managers (and their clients) are best positioned to create lasting value by minimizing distractions and focusing on the long term.
Performance and Attribution Summary
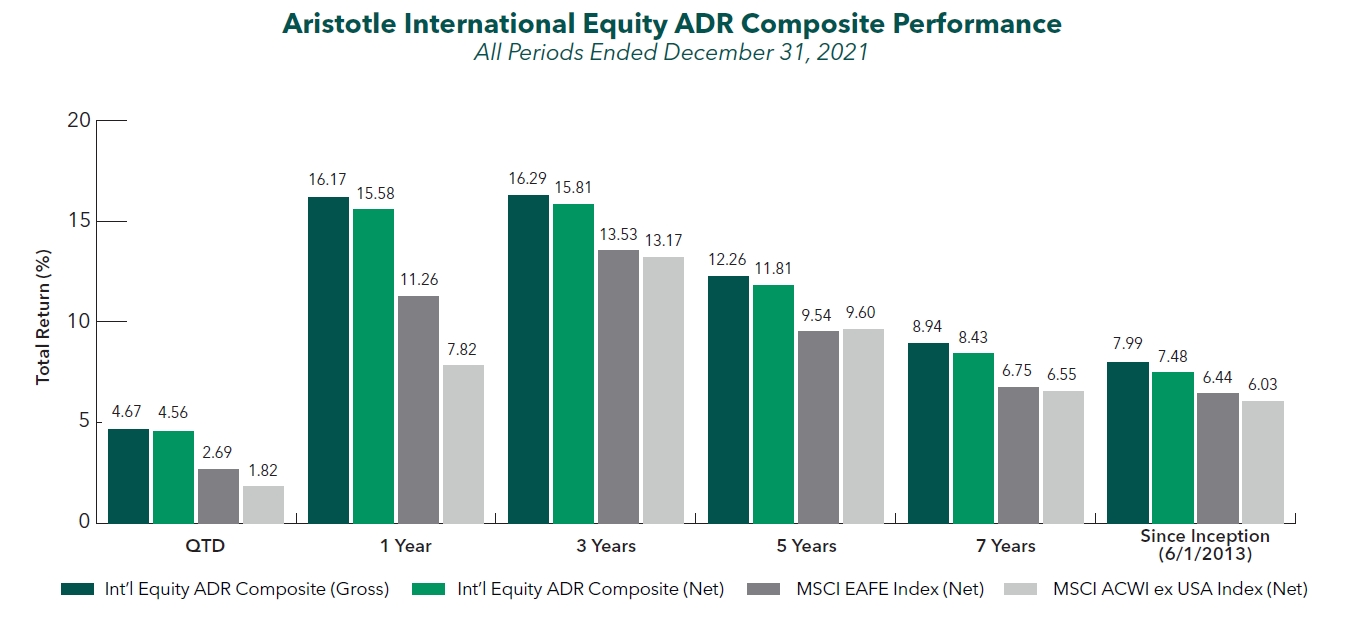
For the fourth quarter of 2021, Aristotle Capital’s International Equity ADR Composite posted a total U.S. dollar return of 4.67% gross of fees (4.56% net of fees), outperforming the MSCI EAFE Index, which returned 2.69%, and the MSCI ACWI ex USA Index, which returned 1.82%. Please refer to the table below for detailed performance.
| Performance (%) | 4Q21 | 1 Year | 3 Years | 5 Years | Since Inception* |
|---|---|---|---|---|---|
| Int’l Equity ADR Composite (gross) | 4.67 | 16.17 | 16.29 | 12.26 | 7.99 |
| Int’l Equity ADR Composite (net) | 4.56 | 15.58 | 15.81 | 11.81 | 7.48 |
| MSCI EAFE Index (net) | 2.69 | 11.26 | 13.53 | 9.54 | 6.44 |
| MSCI ACWI ex USA Index (net) | 1.82 | 7.82 | 13.17 | 9.60 | 6.03 |
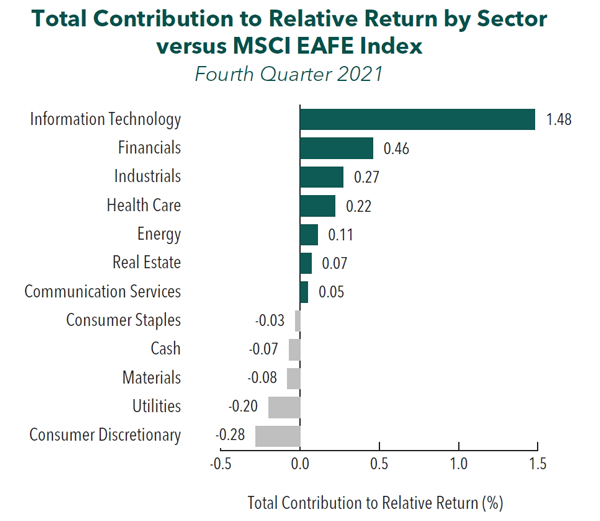
From a sector perspective, the portfolio’s outperformance relative to the MSCI EAFE Index can be attributed to security selection. Security selection in Information Technology, Financials and Industrials contributed the most to the portfolio’s relative performance. Conversely, security selection in Consumer Discretionary and Communication Services and a lack of exposure to Utilities detracted from relative return.
Source: FactSet
Past performance is not indicative of future results. Attribution results are based on sector returns, which are gross of investment advisory fees and include the reinvestment of all income. Please see important disclosures at the end of this document..
Regionally, both security selection and allocation effects were responsible for the portfolio’s outperformance. Security selection in Europe & Middle East and an overweight in Canada contributed the most to relative performance, while an underweight in Europe & Middle East and security selection in the United Kingdom detracted.
Contributors and Detractors for 4Q 2021
| Relative Contributors | Relative Detractors |
|---|---|
| Accenture | Pan Pacific International |
| Brookfield Asset Management | KDDI |
| Sony | Otsuka Holdings |
| Dassault Systèmes | AIA Group |
| Experian | Carnival |
Accenture, the global IT services and consulting firm, was the top contributor during the quarter. Shares continued their impressive performance as the company reported strong results, benefiting from accelerating digital transformations across all markets and industries—a catalyst we previously identified. Revenue for every client industry group that Accenture services increased by double digits from the prior year. Furthermore, the company added 15 Diamond Clients (its most important tier of client) in the first quarter of FY 2022 alone, more than it onboarded for the entirety of FY 2021. We believe Accenture remains uniquely equipped to capitalize on the continuing trend of compressed digital transformations, where enterprises demand comprehensive digital and cloud transformations in a shorter time period. What is striking is that Accenture believes only one-third of the industry has implemented compressed transformation, leaving ample runway for further adoption. In addition, given Accenture’s strong value proposition of providing IT solutions to its long-standing client base of many of the world’s largest companies, we believe it is well positioned to pass on inflationary cost pressures through future price increases, as management intends.
Canada-based alternative asset manager Brookfield Asset Management was also a top contributor during the quarter, as it has continued its fundraising momentum, having raised more than $34 billion in the second half of 2021, and built out significant scale across its private markets offerings. The inflows during the quarter were largely driven by the firm’s flagship funds, including its real estate and infrastructure funds. Through these funds, Brookfield both develops and operates properties across the globe, as well as infrastructure assets that span utilities, transportation and data centers. Also positive for Brookfield, carried interest revenue, additional compensation it receives for high-performing investment funds, rose 9% quarter-over-quarter, a testament to its ongoing stronger realizations of incentive fees. Moreover, the firm has seen sustained outsized demand from institutional investors for its physical asset funds, a catalyst we’ve identified, with management in December expressing its flexibility to potentially increase the future size of these funds.
Pan Pacific International, the Japanese discount and general merchandise retailer, was the quarter’s largest detractor. Operating profits declined more than 30% year-over-year. This was in part due to lower foot traffic during a rainy season in Japan, coupled with a recently more difficult pandemic environment. Spending on technology investments, renovations and new store openings also compressed margins. However, we view these headwinds as temporary, and the investments, renovations and new openings as appropriate capital allocation, and continue to focus on the long-term strength of the business. Pan Pacific’s Don Quijote stores create a sense of treasure hunt that elicits high entertainment value—a unique business model that we believe will allow for organic market share gains in Japan, as well expansion overseas. With the company’s demonstrated ability to turn around competitors’ stores, in our opinion, it also stands to benefit from the ongoing conversion of its acquired UNY locations.
AIA Group, a pan-Asian life insurance company headquartered in Hong Kong, was one of the largest detractors for the quarter. Shares declined despite continued improvements in fundamentals and progress further establishing AIA Group’s direct presence in mainland China, a catalyst we previously identified. AIA Group has benefited from an increasingly technology-enabled and productive agency salesforce; we believe this has helped the company deftly navigate pandemic-related travel restrictions. In fact, the company’s VONB* advanced 15% in the first nine months of 2021, with all areas outside of Hong Kong exceeding pre-pandemic levels. In our opinion, the advances in mainland China are more notable than the interim results. With the recent approval from the China Banking and Insurance Regulatory Commission to begin operations in the Hubei province, AIA Group now has operations in eight provinces, providing what we consider to be a unique platform to further penetrate this increasingly large market.
Recent Portfolio Activity
| Buys | Sells |
|---|---|
| None | None |
Consistent with our long-term horizon and low turnover, there were no new purchases or sales completed during the quarter.
Conclusion
As we turn the page on another year, we are reminded of the fleeting nature of headline news. Our focus is not on factors that will change in the coming months, but rather on the fundamentals of businesses that may persist for years.
Rather than attempting the impossible task of predicting the unpredictable, we remain steadfast in abiding by our investment philosophy and process that have been in place for nearly 25 years. By utilizing a long-term approach and identifying what we perceive to be high-quality businesses, trading at discounts to our estimates of their intrinsic value, that possess catalysts within management’s control, we believe we can withstand short-term swings and add lasting value for our clients.
*Value of New Business (VONB) is an insurance term for the present value of new business written during a period
The opinions expressed herein are those of Aristotle Capital Management, LLC (Aristotle Capital) and are subject to change without notice. Past performance is not a guarantee or indicator of future results. This material is not financial advice or an offer to buy or sell any product. You should not assume that any of the securities transactions, sectors or holdings discussed in this report were or will be profitable, or that recommendations Aristotle Capital makes in the future will be profitable or equal the performance of the securities listed in this report. The portfolio characteristics shown relate to the Aristotle International Equity ADR strategy. Not every client’s account will have these characteristics. Aristotle Capital reserves the right to modify its current investment strategies and techniques based on changing market dynamics or client needs. There is no assurance that any securities discussed herein will remain in an account’s portfolio at the time you receive this report or that securities sold have not been repurchased. The securities discussed may not represent an account’s entire portfolio and, in the aggregate, may represent only a small percentage of an account’s portfolio holdings. The performance attribution presented is of a representative account from Aristotle Capital’s International Equity ADR Composite. The representative account is a discretionary client account which was chosen to most closely reflect the investment style of the strategy. The criteria used for representative account selection is based on the account’s period of time under management and its similarity of holdings in relation to the strategy. Recommendations made in the last 12 months are available upon request.
Returns are presented gross and net of investment advisory fees and include the reinvestment of all income. Gross returns will be reduced by fees and other expenses that may be incurred in the management of the account. For example, a 0.5% annual fee deducted quarterly (0.125%) from an account with a ten-year annualized growth rate of 5.0% will produce a net result of 4.4%. Actual performance results will vary from this example. Please see important disclosures enclosed within this document. The MSCI EAFE Index (Europe, Australasia, Far East) is a free float-adjusted market capitalization-weighted index that is designed to measure the equity market performance of developed markets, excluding the United States and Canada. The MSCI EAFE Index consists of the following 21 developed market country indices: Australia, Austria, Belgium, Denmark, Finland, France, Germany, Hong Kong, Ireland, Israel, Italy, Japan, the Netherlands, New Zealand, Norway, Portugal, Singapore, Spain, Sweden, Switzerland and the United Kingdom. The MSCI ACWI captures large and mid cap representation across 23 developed market countries and 25 emerging markets countries. With approximately 3,000 constituents, the Index covers approximately 85% of the global investable equity opportunity set. The MSCI ACWI Growth Index captures large and mid cap securities exhibiting overall growth style characteristics across 23 developed markets countries and 25 emerging markets countries. The MSCI ACWI Value Index captures large and mid cap securities exhibiting overall value style characteristics across 23 developed markets countries and 25 emerging markets countries. The MSCI ACWI ex USA Index captures large and mid cap representation across 22 of 23 developed markets countries (excluding the United States) and 25 emerging markets countries. With over 2,300 constituents, the Index covers approximately 85% of the global equity opportunity set outside the United States. The MSCI Emerging Markets Index is a free float-adjusted market capitalization-weighted index that is designed to measure the equity market performance of emerging markets. The MSCI Emerging Markets Index consists of the following 25 emerging market country indexes: Brazil, Chile, China, Colombia, Czech Republic, Egypt, Greece, Hungary, India, Indonesia, Korea, Kuwait, Malaysia, Mexico, Peru, Philippines, Poland, Qatar, Russia, Saudi Arabia, South Africa, Taiwan, Thailand, Turkey and United Arab Emirates. The S&P 500® Index is the Standard & Poor’s Composite Index of 500 stocks and is a widely recognized, unmanaged index of common stock prices. The Brent Crude Oil Index is a major trading classification of sweet light crude oil that serves as a major benchmark price for purchases of oil worldwide. The MSCI Japan Index is designed to measure the performance of the large and mid cap segments of the Japanese market. With over 250 constituents, the Index covers approximately 85% of the free float-adjusted market capitalization in Japan. The Bloomberg Global Aggregate Bond Index is a flagship measure of global investment grade debt from 28 local currency markets. This multi-currency benchmark includes treasury, government-related, corporate and securitized fixed-rate bonds from both developed and emerging markets issuers. The MSCI United Kingdom Index is designed to measure the performance of the large and mid cap segments of the U.K. market. With nearly 100 constituents, the Index covers approximately 85% of the free float-adjusted market capitalization in the United Kingdom. The MSCI Europe Index captures large and mid cap representation across 15 developed markets countries in Europe. With over 430 constituents, the Index covers approximately 85% of the free float-adjusted market capitalization across the European developed markets equity universe. These indices have been selected as the benchmarks and are used for comparison purposes only. The volatility (beta) of the Composite may be greater or less than the respective benchmarks. It is not possible to invest directly in these indices.
Aristotle Capital Management, LLC is an independent registered investment adviser under the Advisers Act of 1940, as amended. Registration does not imply a certain level of skill or training. More information about Aristotle Capital, including our investment strategies, fees and objectives, can be found in our Form ADV Part 2, which is available upon request. ACM-2201-145-MLFA
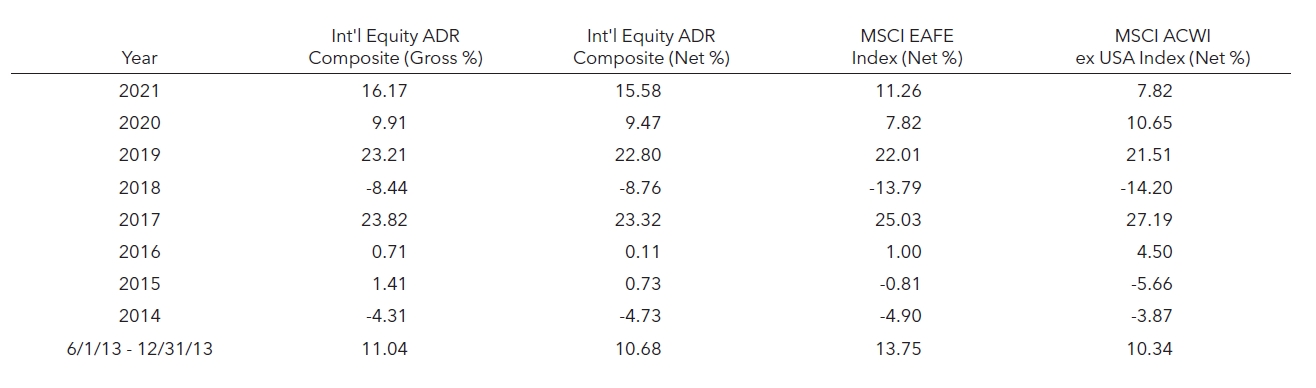
Composite returns for all periods ended December 31, 2021 are preliminary pending final account reconciliation.
The performance information presented is based on the Aristotle International Equity ADR Composite.
Past performance is not indicative of future results. Performance results for periods greater than one year have been annualized. Returns are presented gross and net of investment advisory fees and include the reinvestment of all income. Gross returns will be reduced by fees and other expenses that may be incurred in the management of the account. For example, a 0.5% annual fee deducted quarterly (0.125%) from an account with a ten-year annualized growth rate of 5.0% will produce a net result of 4.4%. Actual performance results will vary from this example. Please see important disclosures
enclosed within this document.