
Merrill Lynch
International Equity ADR 2Q 2022
FOR FINANCIAL PROFESSIONAL USE ONLY. NOT FOR USE WITH THE PUBLIC.
(All MSCI index returns are shown net and in U.S. dollars unless otherwise noted.)
Markets Review
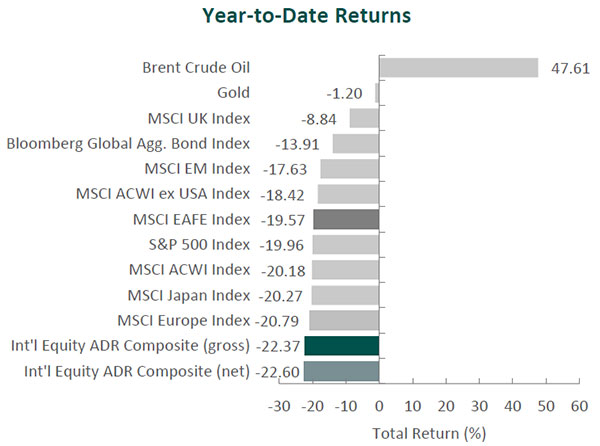
Global equity markets continued their decline during the second quarter. Overall, the MSCI ACWI Index fell 15.66% during the period. Concurrently, the Bloomberg Global Aggregate Bond Index pulled back 8.26%. In terms of style, value stocks outperformed their growth counterparts during the quarter, with the MSCI ACWI Value Index beating the MSCI ACWI Growth Index by 8.66%.
Sources: SS&C Advent, Bloomberg
Past performance is not indicative of future results. Aristotle International Equity ADR Composite returns are presented gross and net of investment advisory fees and include the reinvestment of all income. Aristotle Capital Composite returns are preliminary pending final account reconciliation. Please see important disclosures at the end of this document.
The MSCI EAFE Index dropped 14.51% during the second quarter, while the MSCI ACWI ex USA Index decreased 13.73%. Regionally, Europe & Middle East and Asia were the weakest performers, while the U.K. declined the least. On a sector basis, all eleven sectors within the MSCI EAFE Index posted negative returns, with Information Technology, Materials and Industrials producing the largest losses. Conversely, Energy, Consumer Staples and Health Care declined the least.
Geopolitical tensions remained high as the war in the Ukraine continued. Western governments intensified their pressure on Russia through various sanctions, such as bans on Russian oil and gold, causing the country to default on its foreign debt for the first time since 1918.
The outlook for global economic activity and inflation remains complicated by the ongoing conflict. The IMF projects global growth to slow from an estimated 6.1% in 2021 to 3.6% in 2022. Additionally, the IMF raised its 2022 estimates for inflation to 5.7% in advanced economies and 8.7% in emerging/developing economies. This broad-based increase in prices, against the backdrop of continued supply-chain disruptions and geopolitical tensions, has stoked fears that a global recession may be on the horizon.
To address elevated inflation, most central banks have started to, or have plans to, enact tighter monetary policies. For example, the Bank of England increased rates by a quarter percentage point in June to 1.25%, the fifth consecutive rise and the highest level in 13 years, and the European Central Bank has confirmed plans to raise rates by a quarter point at its July policy meeting.
Meanwhile, in China, the government imposed a strict lockdown in Shanghai and other cities throughout the country to combat rising COVID cases, further disrupting the global supply chain. However, unlike its western counterparts, the People’s Bank of China pledged to maintain accommodative policies to support China’s slowing economy in the form of a new stimulus policy package and the lowering of its five-year benchmark lending rate. The Bank of Japan similarly stated it will stay the course with its ultra-easy monetary policy, as the country’s economy has been less affected by inflation. (At the time of this writing, Japan and the world were saddened by the assassination of former Prime Minister Shinzo Abe, who was the longest-serving prime minister in Japan’s history [2006 to 2007 and 2012 to 2020].)
The divergence in central bank policies has created sharp movements in currencies. Perhaps most prominent has been the U.S. dollar’s (USD) strengthening against the Euro, Yen and Yuan. Year-to-date returns in local currency for the MSCI Europe and MSCI Japan indices were reduced by 7.22% and 14.34%, respectively, when translated into USD.
Performance and Attribution Summary
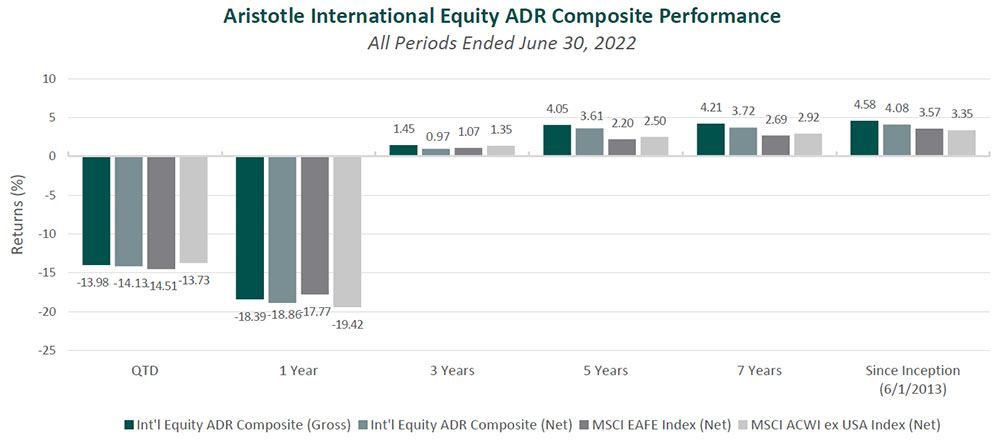
For the second quarter of 2022, Aristotle Capital’s International Equity ADR Composite posted a total return of -13.98% gross of fees (-14.13% net of fees), outperforming the MSCI EAFE Index, which returned -14.51%, and slightly underperforming the MSCI ACWI ex USA Index, which returned -13.73%. Please refer to the table below for detailed performance.
| Performance (%) | 2Q22 | YTD | 1 Year | 3 Years | 5 Years | Since Inception* |
|---|---|---|---|---|---|---|
| Int’l Equity ADR Composite (gross) | -13.98 | -22.37 | -18.39 | 1.45 | 4.05 | 4.58 |
| Int’l Equity ADR Composite (net) | -14.13 | -22.60 | -18.86 | 0.97 | 3.61 | 4.08 |
| MSCI EAFE Index (net) | -14.51 | -19.57 | -17.77 | 1.07 | 2.20 | 3.57 |
| MSCI ACWI ex USA Index (net) | -13.73 | -18.42 | -19.42 | 1.35 | 2.50 | 3.35 |
Source: FactSet
Past performance is not indicative of future results. Attribution results are based on sector returns, which are gross of investment advisory fees and include the reinvestment of all income. Please see important disclosures at the end of this document..
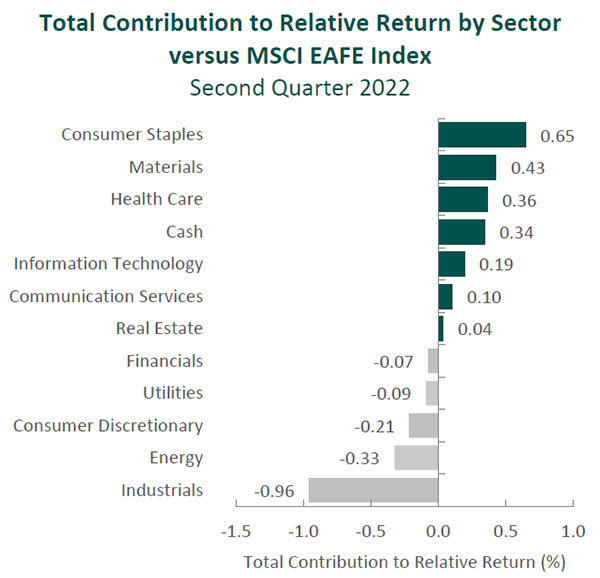
From a sector perspective, the portfolio’s outperformance relative to the MSCI EAFE Index can be attributed to both security selection and allocation effects. Security selection in Consumer Staples and Health Care and an underweight in Materials contributed to relative return. Conversely, security selection in Industrials and Energy and an overweight in Industrials detracted the most from the portfolio’s relative performance.
Regionally, security selection was responsible for the portfolio’s outperformance. Security selection in Europe & Middle East and Asia contributed, while security selection in the U.K. and our exposure to Canada detracted the most from relative performance.
Contributors and Detractors for 2Q 2022
| Contributors | Detractors |
|---|---|
| Coca-Cola Europacific Partners | Ashtead Group |
| TotalEnergies | Credicorp |
| ING Groep | Dassault Systèmes |
| GSK | Carnival |
| Pan Pacific International | Cameco |
Coca-Cola Europacific Partners (CCEP), the multinational bottling company, was a top contributor for the quarter. Formed in 2016 via a tri-party merger of the three main Western European bottling companies, CCEP continues to display its strength integrating acquisitions, harvesting synergies and improving the combined franchises. The company’s 2021 acquisition of Australia-based bottler Coca-Cola Amatil is progressing nicely, with further opportunities for synergies and improvements in working capital identified. With economies reopening, CCEP’s operations are experiencing strong volume growth, as well as favorable pricing. Specifically, the reopening of the away-from-home channel in Europe has been robust, with several markets reaching or exceeding 2019 volume levels. Additionally, product innovation, such as the compact Freestyle drinks dispenser for small sites, remains a priority for the company, and we believe it will aid in capturing market share over time. CCEP also continues to invest in digital solutions, such as a B2B portal that assists and facilitates customers’ ordering and monitoring processes, which now represent ~30% of the away-from-home business.
TotalEnergies, one of the world’s largest energy companies, was also a primary contributor for the quarter. The company has made progress in its strategic plan to reach net-zero emissions by 2050 which, in contrast to many European energy providers, it plans to achieve through expanding ownership of renewable power and low-carbon assets, rather than purely divestment. As such, during the quarter, it acquired a 25% stake in Adani New Industries, an Indian venture centered on green hydrogen (including solar panels and wind turbines), as well as a 50% interest in Clearway Energy Group, the fifth-largest renewable company in the U.S. Both of these acquisitions strengthen our conviction that TotalEnergies is uniquely positioned to benefit from the increase in global demand for clean energy. It is also notable that higher commodity prices and wider refining margins have been constructive for the company’s financial performance. As a result, TotalEnergies increased its share-repurchase program for the first half of 2022 by $1 billion. In recent years, TotalEnergies’ reduction in capex and operating expenses has improved its FREE cash flow generation, now further aided by the favorable energy environment. This has supported its continued ability to return cash to shareholders, one of our catalysts.
AshteadGroup, a U.K.-headquartered equipment rental company, was a leading detractor for the quarter. The company’s share price declined despite the company’s solid fundamental performance. This included a 22% increase in rental revenue during the year and progress made on improving many aspects of the business. Supply-chain constraints, which resulted in customers opting to rent rather than purchase equipment, have accelerated our catalyst of increased rental penetration. Furthermore, we believe there is ample runway for this trend to continue, as rental penetration in the U.S. (~90% of EBITDA) is roughly 55% compared to 75% in the U.K. In addition, Ashtead has made further advances consolidating the rental industry, having spent $1.3 billion in the last year on 25 bolt-on acquisitions that added another 123 locations in North America. We believe this should result in a more disciplined and attractive market. The company has also seen strong growth (up 34% during the quarter) in its higher-margin specialty rental business – another catalyst – that includes HVAC equipment and scaffolding. All of these developments have reinforced our confidence in Ashtead’s continued ability to utilize its national footprint, procurement power and quality service to increase its market share.
After making a strong run in the beginning of the year, Cameco, the world’s largest publicly traded uranium producer, was a primary detractor for the quarter. As countries focus on energy security and increasingly rely on nuclear energy, market dynamics are shifting in Cameco’s favor. Supply has tightened as the developed world pivots from Russia, a large supplier of uranium, while demand for non-Russia-linked uranium has increased. While we recognize there has been, and will likely continue to be, short-term volatility in uranium prices, we admire Cameco’s prior actions of operational discipline, which we believe have positioned the company to benefit from the current market dynamics. Cameco remains focused on prudently and profitably increasing production of its Canada-based assets, including an increase of its ownership stake in the Cigar Lake joint venture, as well as the planned start of production at the McArthur River/Key Lake mines in 2024. As these operations come online, we believe Cameco will be able to meet its utilities customers’ demand for long-term supply at higher equilibrium prices.
Recent Portfolio Activity
| Buys | Sells |
|---|---|
| Munich Re Group | Close Brothers Group |
Our investment in Close Brothers dates back to the first quarter of 2018. The company is a “challenger bank” in the U.K., providing banking and asset management services to retail customers and small businesses. During our more than four-year holding period, management focused on maintaining profitability through lending discipline. Although this resulted in modest loan growth, the company recorded strong profitability and capital levels. This prudent approach preserved profitability through the cycle, with return on equity above 10% and (with the exception of 2020) year-over-year growth in dividends per share. With few catalysts on the horizon, we decided to exit our position to fund the purchase of Munich Re Group.
Munich Re Group
Founded in 1880, Munich Re Group is the world’s largest reinsurance company.1 The company is globally active across all lines of the insurance industry, with reinsurance accounting for ~70% of gross premiums. Munich Re’s reinsurance policies cover a wide variety of risks, including the impacts of natural disasters, cybersecurity breaches and agricultural shortfalls, as well as life and health. The company also offers primary insurance through its subsidiary ERGO (~30% of gross premiums), predominately to retail customers in Germany.
Reinsurance is insurance for insurers and typically purchased by primary insurers (those that insure a life, car, home, building or business). This allows primary insurers to diversify and limit the size of risk, protect against extreme outcomes, and tap into expertise that a primary insurer may not possess internally. Reinsurers can be seen as among the purest form of insurance companies, as they are paid premiums to underwrite risk and manage conservative investment portfolios.
1Based on net reinsurance premiums written in 2020.
Quality
Some of the quality characteristics we have identified for Munich Re include:
– Robust brand, market position and client relationships have allowed it to achieve scale, with over €300 billion in assets and nearly €60 billion in gross premiums written in 2021;
– Well diversified across product lines, sectors and geographies;
– Financial strength, as evidenced by its low debt leverage relative to its peers and strong solvency, with incurred-but-not-yet-reported2 reserves having increased from 45% to 63% of total claims reserves between 2005 and 2020; and
– Experienced management team with a focus on innovation in the business that is unusual for an insurer of its size.
2Incurred-but-not-reported is a type of reserve account used in the insurance industry as the provision for claims and/or events that are estimated to have transpired but have not yet been reported to an insurance company.
Attractive Valuation
In our view, based on our estimates of higher normalized earnings and market share, Munich Re’s current share price does not fully reflect the company’s intrinsic value. More specifically, given its current ~5% dividend yield and consistent ability to return profits to shareholders – increasing or maintaining its dividend for over 50 years – we believe the current valuation of ~10x earnings is attractive.
Compelling Catalysts
Catalysts we have identified for Munich Re, which we believe will cause its stock price to appreciate over our three- to five-year investment horizon, include:
– Continued underwriting discipline, along with the benefits of scale and utilization of technology, should improve profitability;
– Further penetration across many of its reinsurance segments due to investment in R&D and product development; and;
– Market share gains in a variety of areas, including cybersecurity and fast-growing economies in Asia, where the market is large but insurance penetration remains relatively low.
Conclusion
In the first half of 2022, we witnessed a new, significant geopolitical conflict, soaring inflation and tighter monetary policy. As usual, every period (up or down) brings its own “news of the day” questions, which at the time may seem critical: Is the economy entering a recession? If so, how long will it last? What will central banks do next? … and so on. Instead of spending our time making predictions or analyzing the “news of the day” (which can change rapidly), we continue to direct our efforts toward understanding the long-term fundamentals of businesses. Before investing in a company, we spend time understanding its experience in prior times of adversity, its ability (or inability) to express pricing power, management’s ability to react to changing conditions and many other factors that may impact a company’s sustainable competitive advantages. Today, we continue to focus on the long-term fundamentals of businesses, as we believe this is the best way for us to serve our clients.
The opinions expressed herein are those of Aristotle Capital Management, LLC (Aristotle Capital) and are subject to change without notice. Past performance is not a guarantee or indicator of future results. This material is not financial advice or an offer to buy or sell any product. You should not assume that any of the securities transactions, sectors or holdings discussed in this report were or will be profitable, or that recommendations Aristotle Capital makes in the future will be profitable or equal the performance of the securities listed in this report. The portfolio characteristics shown relate to the Aristotle International Equity ADR strategy. Not every client’s account will have these characteristics. Aristotle Capital reserves the right to modify its current investment strategies and techniques based on changing market dynamics or client needs. There is no assurance that any securities discussed herein will remain in an account’s portfolio at the time you receive this report or that securities sold have not been repurchased. The securities discussed may not represent an account’s entire portfolio and, in the aggregate, may represent only a small percentage of an account’s portfolio holdings. The performance attribution presented is of a representative account from Aristotle Capital’s International Equity ADR Composite. The representative account is a discretionary client account which was chosen to most closely reflect the investment style of the strategy. The criteria used for representative account selection is based on the account’s period of time under management and its similarity of holdings in relation to the strategy. Recommendations made in the last 12 months are available upon request.
Returns are presented gross and net of investment advisory fees and include the reinvestment of all income. Gross returns will be reduced by fees and other expenses that may be incurred in the management of the account. Net returns are presented net of actual investment advisory fees and after the deduction of all trading expenses.
The MSCI EAFE Index (Europe, Australasia, Far East) is a free float-adjusted market capitalization-weighted index that is designed to measure the equity market performance of developed markets, excluding the United States and Canada. The MSCI EAFE Index consists of the following 21 developed market country indices: Australia, Austria, Belgium, Denmark, Finland, France, Germany, Hong Kong, Ireland, Israel, Italy, Japan, the Netherlands, New Zealand, Norway, Portugal, Singapore, Spain, Sweden, Switzerland and the United Kingdom. The MSCI ACWI captures large and mid-cap representation across 23 developed market countries and 24 emerging markets countries. With approximately 3,000 constituents, the Index covers approximately 85% of the global investable equity opportunity set. The MSCI ACWI Growth Index captures large and mid-cap securities exhibiting overall growth style characteristics across 23 developed markets countries and 24 emerging markets countries. The MSCI ACWI Value Index captures large and mid-cap securities exhibiting overall value style characteristics across 23 developed markets countries and 24 emerging markets countries. The MSCI ACWI ex USA Index captures large and mid-cap representation across 22 of 23 developed markets countries (excluding the United States) and 24 emerging markets countries. With approximately 2,300 constituents, the Index covers approximately 85% of the global equity opportunity set outside the United States. The MSCI Emerging Markets Index is a free float-adjusted market capitalization-weighted index that is designed to measure the equity market performance of emerging markets. The MSCI Emerging Markets Index consists of the following 24 emerging market country indexes: Brazil, Chile, China, Colombia, Czech Republic, Egypt, Greece, Hungary, India, Indonesia, Korea, Kuwait, Malaysia, Mexico, Peru, Philippines, Poland, Qatar, Saudi Arabia, South Africa, Taiwan, Thailand, Turkey and United Arab Emirates. The S&P 500® Index is the Standard & Poor’s Composite Index of 500 stocks and is a widely recognized, unmanaged index of common stock prices. The Brent Crude Oil Index is a major trading classification of sweet light crude oil that serves as a major benchmark price for purchases of oil worldwide. The MSCI Japan Index is designed to measure the performance of the large and mid-cap segments of the Japanese market. With approximately 250 constituents, the Index covers approximately 85% of the free float-adjusted market capitalization in Japan. The Bloomberg Global Aggregate Bond Index is a flagship measure of global investment grade debt from 28 local currency markets. This multi-currency benchmark includes treasury, government-related, corporate and securitized fixed-rate bonds from both developed and emerging markets issuers. The MSCI United Kingdom Index is designed to measure the performance of the large and mid-cap segments of the U.K. market. With nearly 100 constituents, the Index covers approximately 85% of the free float-adjusted market capitalization in the United Kingdom. The MSCI Europe Index captures large and mid-cap representation across 15 developed markets countries in Europe. With approximately 430 constituents, the Index covers approximately 85% of the free float-adjusted market capitalization across the European developed markets equity universe. These indices have been selected as the benchmarks and are used for comparison purposes only. The volatility (beta) of the Composite may be greater or less than the respective benchmarks. It is not possible to invest directly in these indices.
Aristotle Capital Management, LLC is an independent registered investment adviser under the Advisers Act of 1940, as amended. Registration does not imply a certain level of skill or training. More information about Aristotle Capital, including our investment strategies, fees and objectives, can be found in our Form ADV Part 2, which is available upon request. ACM-2207-150-MLFA
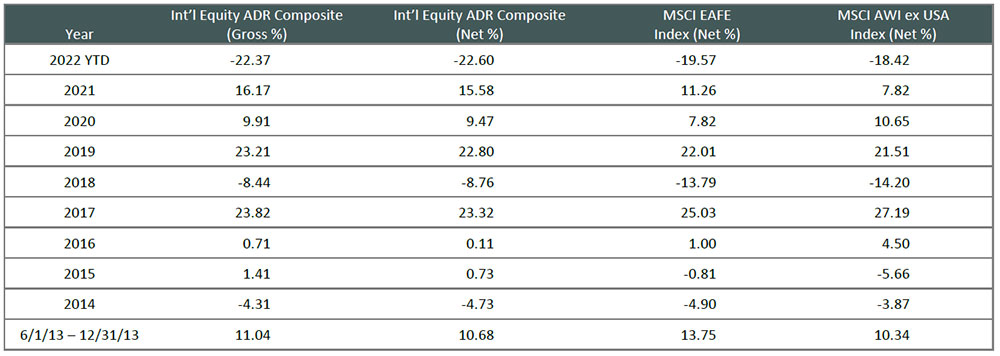
Composite returns for all periods ended June 30, 2022 are preliminary pending final account reconciliation.
The performance information presented is based on the Aristotle International Equity ADR Composite. Past performance is not indicative of future results.
Performance results for periods greater than one year have been annualized. Returns are presented gross and net of investment advisory fees and include the reinvestment of all income. Please see important disclosures within this document.